Google Ads
Google Ads (Marketing Analytics → Google Ads) shows campaign performance pulled directly from your connected Google Ads account for your selected brand and date range — what the ad platform itself measured, before it's matched to your actual clients.
Google spend reporting starts 1 January 2026. Earlier spend isn't reported, so a date range beginning before 2026 returns only the part from January 2026 onward.
 123
Date controls
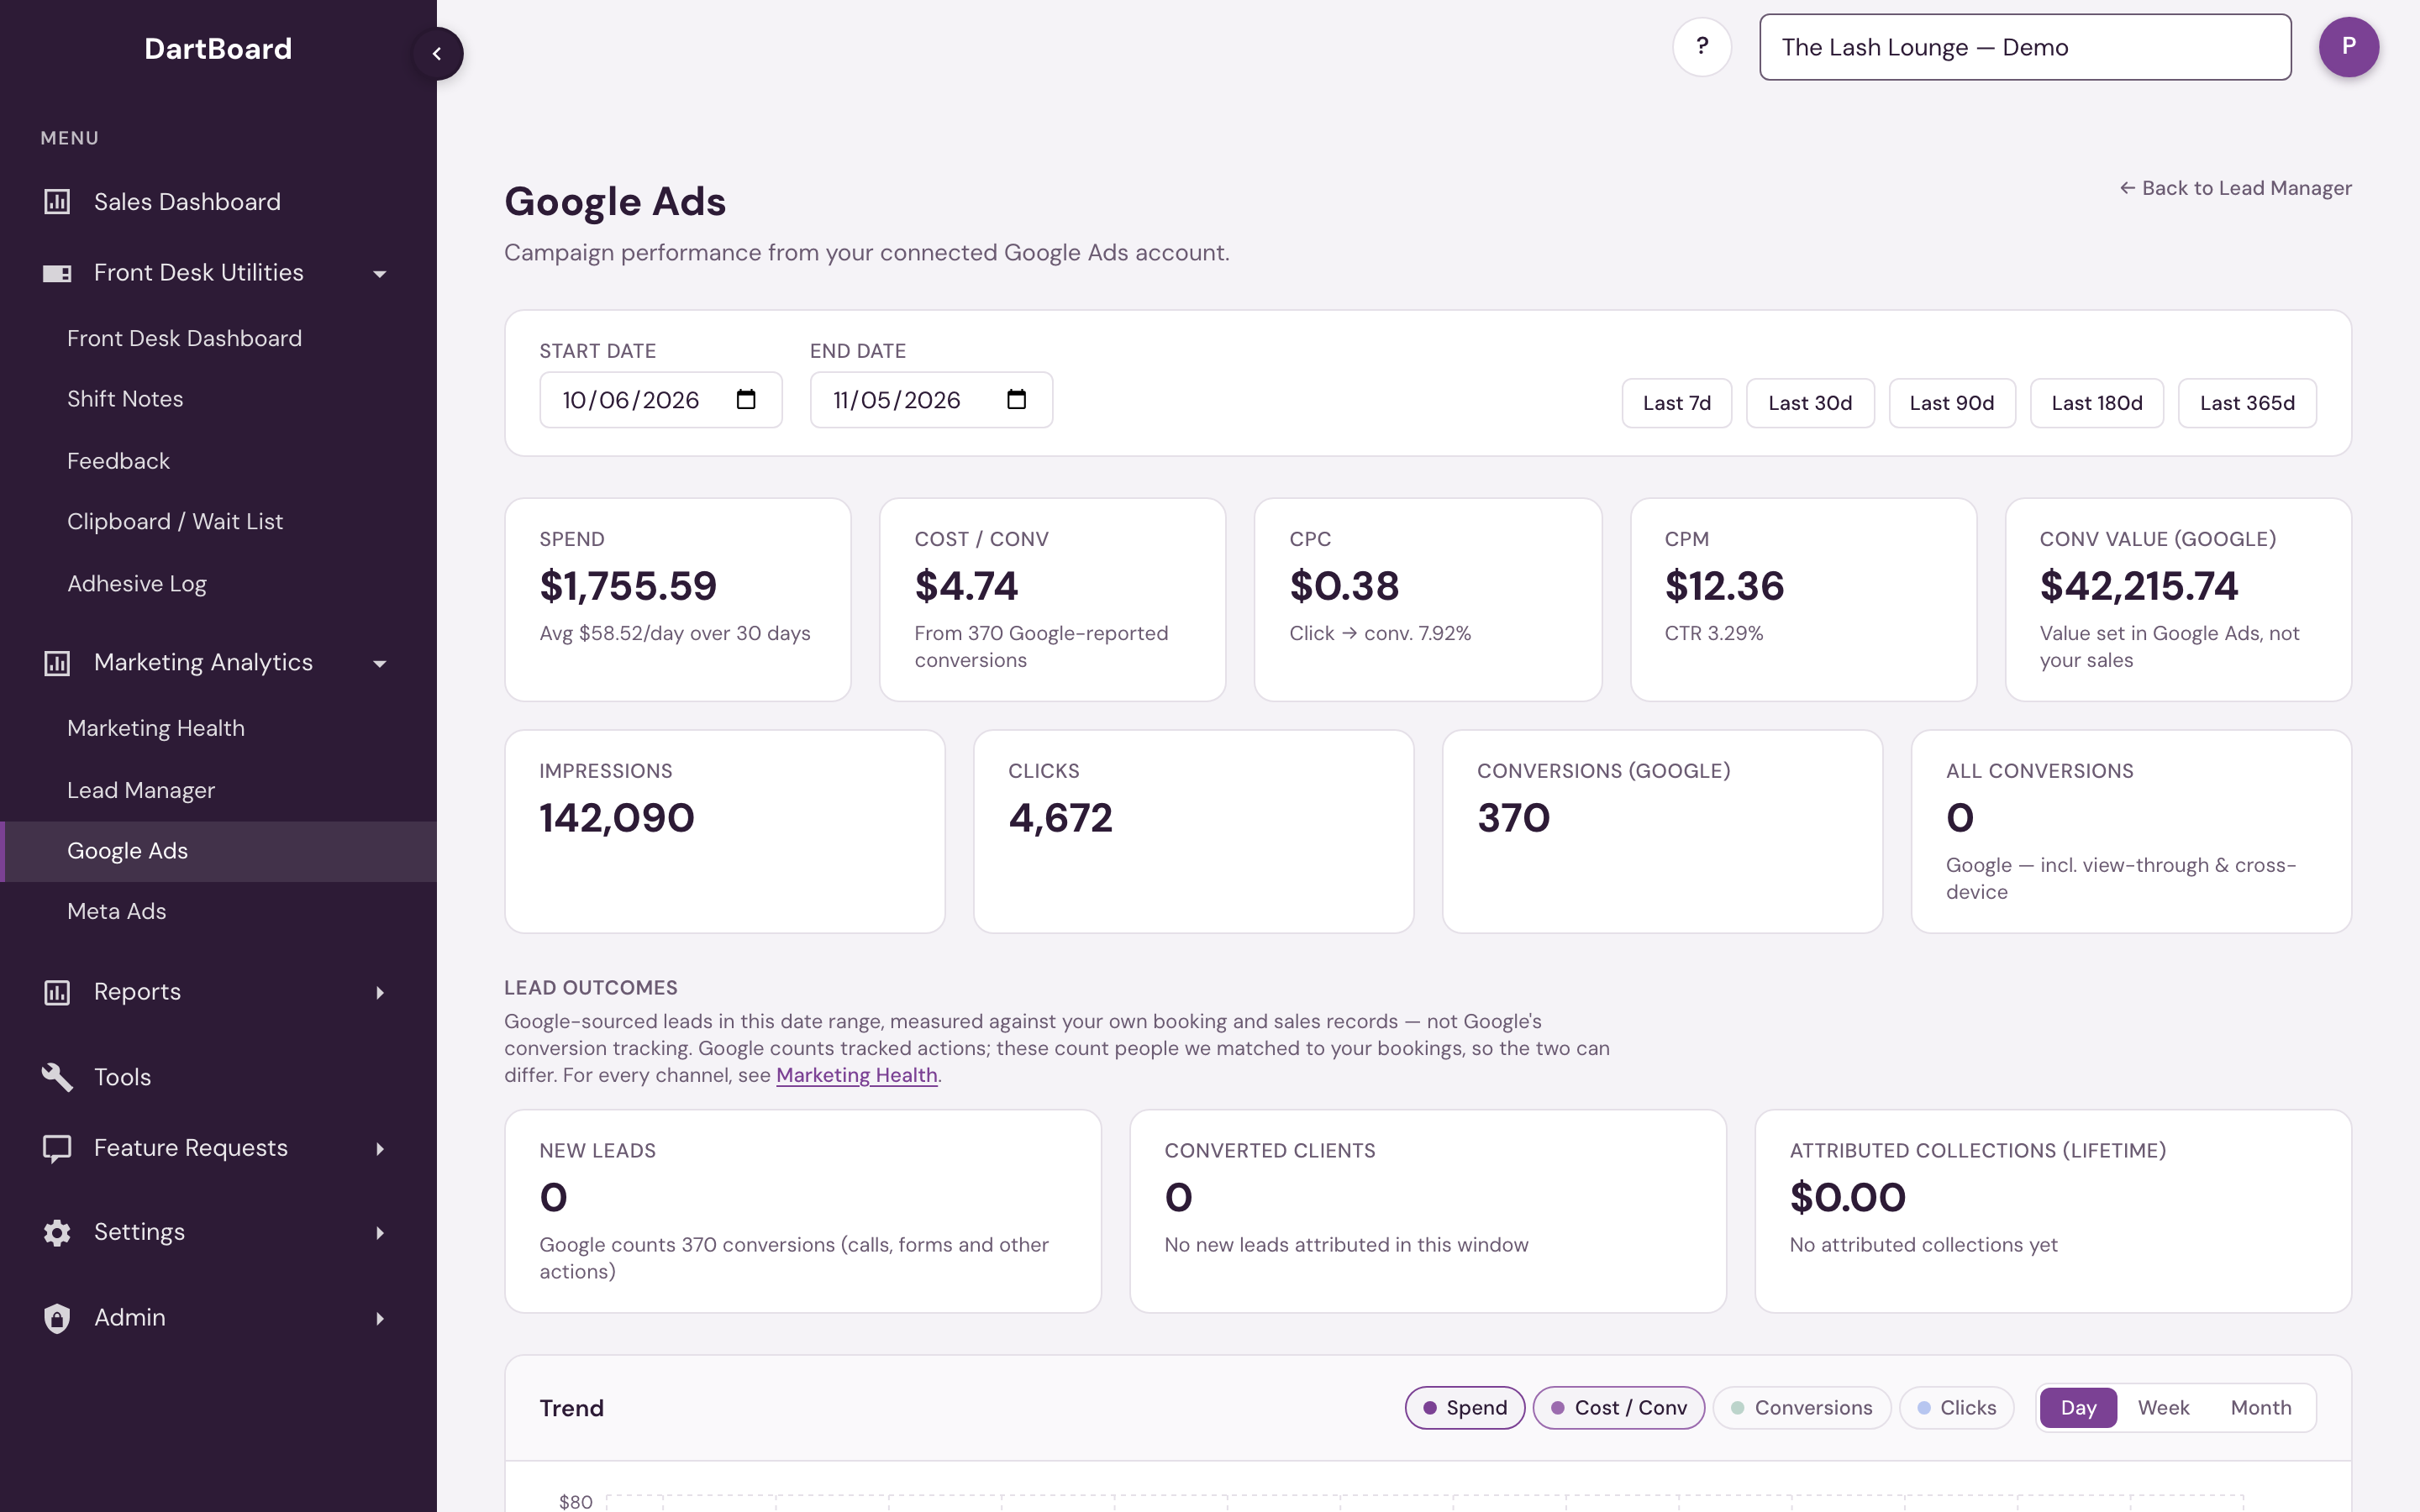
Pick a custom Start date / End date, or use the Last 7d / 30d / 90d / 180d / 365d quick presets. Everything below the date controls — tiles, trend, funnel, campaigns table, and breakdowns — reflects this window.

KPI tiles
The top row is efficiency-first — what was spent, how efficiently, and what was returned:
- Spend — total Google Ads spend in the window, with average spend per day underneath.
- Cost / Conv — cost per Google-reported conversion.
- CPC — cost per click, with the conversion rate alongside it.
- CPM — cost per thousand impressions, with CTR alongside it.
- Conv Value (Google) — a value set up in your Google Ads account for each conversion, added up. It is not your sales; for what converted clients actually spent, see Attributed Collections.
A second row covers volume: Impressions, Clicks, Conversions (Google), and All Conversions. Both conversion figures come from Google's tracking. Conversions (Google) is its primary count (the actions you told Google to optimize for), while All Conversions adds the other actions Google credits, such as view-through and cross-device conversions.
A Lead Outcomes row provides the first-party counterweight, using your booking and sales records rather than Google's conversion tracking:
- New Leads — the same lead count used by Marketing Health, after existing customers and repeat inquiries are excluded.
- Converted Clients — how many of those New Leads completed a non-cancelled visit, with the full arithmetic shown. A completed $0 membership-credit or redemption visit counts; a booking alone does not.
- Attributed Collections (Lifetime) — what those converted clients have spent since, with ROAS underneath.
Google's Conversions (Google) and Conv Value (Google) will often differ from Lead Outcomes because they come from a different source and use Google's attribution rules.
Trend & funnel
A Trend chart plots Spend, Cost / Conv, Conversions, and Clicks by day, week, or month — toggle which lines and which granularity you want. Spend is what Google charged. Cost / Conv is spend divided by the conversions Google counts (calls, forms and other actions you set up in Google Ads), not your leads; its line breaks on days with no conversions. In the daily view, a dashed line shows the 7-day average, and today is left off until its numbers are complete. Underneath it, a 3-step Funnel runs from impressions to clicks to conversions for the selected window. Each step shows its count and its share of the step above, for example 9.4% of impressions for clicks (your click-through rate) and 8.4% of clicks for conversions. The line at the bottom gives the share of impressions that became conversions. Google can split the credit for one conversion across several ad clicks, so its own count can include fractions; the page rounds it to whole conversions.
Campaigns table
Below the trend and funnel, every campaign in the period is listed with Status, Channel, Daily Budget, Spend, Impressions, Clicks, CTR, CPC, CPM, Conv, Conv Value, and Cost / Conv. Click a campaign row to expand it and see the ad groups underneath, with the same window applied.
Breakdowns
A collapsible Breakdowns section (open by default) covers where results come from: a Network donut (Search, Display, YouTube, and so on), an Age bar chart, a Gender bar chart, and an Hour of day heatmap for spend or impressions — each showing attributed spend against total spend where Google doesn't report a breakdown for every dollar. Hour of day shows what Google charged and how often your ads were shown in each hour of the day, added up across the selected dates, in your Google Ads account's time zone. Point to or tap an hour to see its impressions, spend and clicks. It covers up to 60 days: on a longer range it shows the last 60 days and says Last 60 days next to the title.
Full-Funnel ROAS
Further down the page, a Full-Funnel ROAS section — with its own Include collections through control — brings in the same real-outcomes data as Marketing Health, scoped to Google:
- Google — Campaign ROAS — every campaign, sortable by the collections it actually drove over the selected horizon.
You may also see a Google Paid (unattributed) row: leads we know came from Google ads but can't tie to one campaign, mostly phone calls where the call tracking didn't record which campaign. Where a figure isn't knowable for that row — like its share of spend — the table shows a dash rather than a misleading $0, so campaign-level ROAS stays honest.
Campaign-level outcomes also appear here, below the account-level Lead Outcomes row.
How this differs from Marketing Health
This page separates what Google knows — impressions, clicks, spend, Google-counted conversions, and Google's conversion value — from Lead Outcomes, which uses your booking and sales records. Marketing Health uses those same first-party New Leads, Converted Clients, and collections definitions across Meta and Google together. Use this page to tune Google campaigns; use Marketing Health to judge the cross-channel return overall.
Salons that share advertising
Some salons advertise together. When the salon you have selected is one of them, this page shows the group combined: ad spend, leads, sales and results for all of the salons together. A note at the top of the page names the salons. Choosing any salon in the group shows the same combined page.
Same access as the rest of Marketing Analytics: Marketing Analytics must be turned on for your salon, and you need to be a corporate or admin user or have the Marketing Dashboard Access permission. Ad data updates automatically every day.