Marketing Health
Marketing Health (Marketing Analytics → Marketing Health in the sidebar) follows every ad dollar through to clients who completed a non-cancelled visit and the collections they generate — not just clicks and pixel events. A $0 visit paid with membership credit or a redemption still counts as a conversion. One view connects the whole journey:
Ad spend → Leads → Converted clients → Collections
with ROAS (return on ad spend), cost per lead, and cost per acquired client at each step.
At the top right of the page, Marketing Partner names the marketing partner the salon works with today, as recorded by your corporate team under Franchise Management → Marketing Partners. Not assigned means no partner is on record for the salon.
 12345
A lead counts as convertedA lead counts as converted once they've had a completed, non-cancelled visit after their inquiry — a booking alone doesn't count.Full definition → once they've had a completed visit — the same definition used on the Lead Manager — and collections are measured with the same formula as your Sales DashboardMoney actually taken in, on the day it was paid. Tips are left out, and a gift card or membership credit counts when it is bought, not again when it is spent.Full definition →, so the numbers match what you already trust.
Date range
The Date range control picks which leads and ad spend to include — for example, leads that arrived in June — with quick presets (Last 7/30/90/180/365 days) alongside custom start and end dates.
Days follow the salon's own clock: a lead that arrives at 7 pm on the 30th at the salon counts on the 30th, whatever the time zone of the person reading the page. Lead Manager, the Marketing Leads report and Salon Performance by Marketing Partner count days the same way, so their New Leads agree for the same dates.
The range is shared with the Lead Manager: change it on either page and the other opens on the same window, so numbers on the two pages are always describing the same period. Until you pick a range, this page starts on the last 90 days (the Lead Manager starts on the last 30).

This is a different question from the Include collections through control below it, which governs how long after each lead arrived to keep counting their spend.
Collections & ROAS
The Include collections through control in the top right of this card governs how long after each lead arrived their collections keep counting toward the numbers on screen: First Visit (the first completed visit only), First 30d, First 90d, First 180d (counted from the day the lead came in), or Lifetime. The horizon matters because new clients keep coming back, so a single ad dollar keeps earning — a campaign that looks break-even at first visit can look very different over 90 days, and the horizon control lets you see exactly how it develops for your salon.

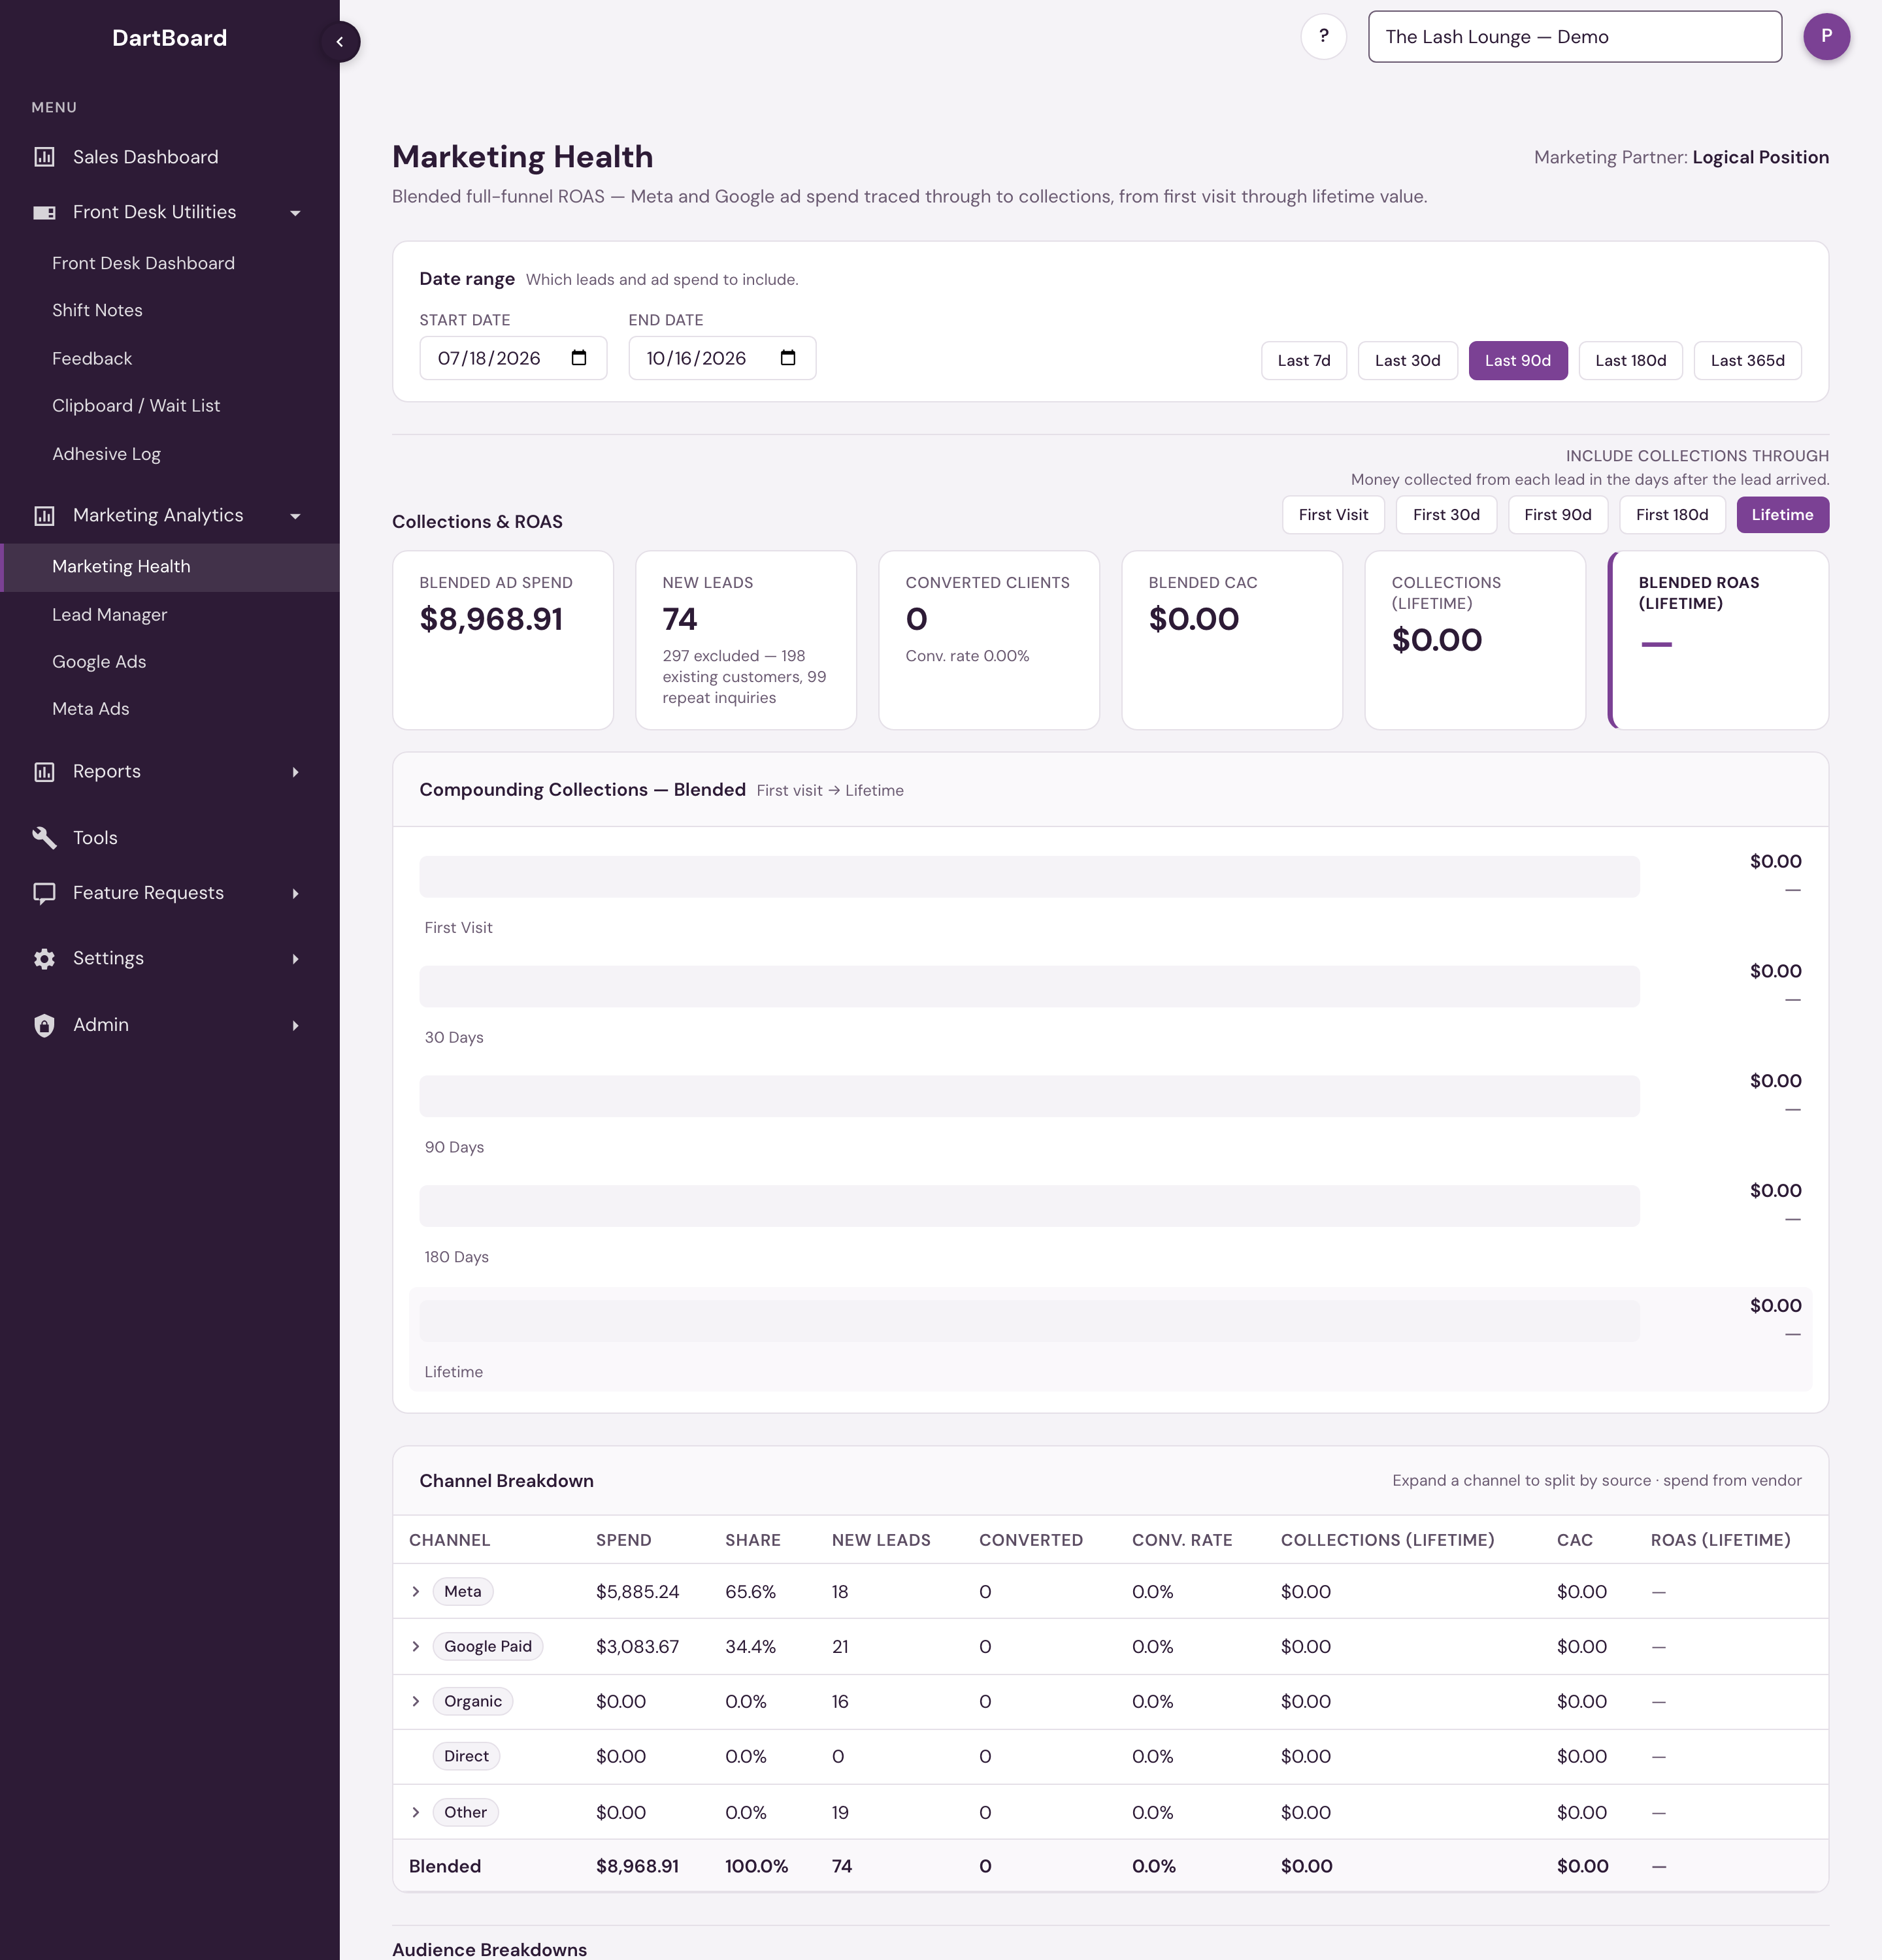
Six tiles summarize the selected date range and horizon:
- Blended Ad Spend — total Meta + Google spend in the date range.
- New Leads — genuinely new inquiries in the date range (existing clients, and repeat inquiries from someone who already reached out, are excluded — see below).
- Converted Clients — how many of those leads completed a non-cancelled visit, with the conversion rate underneath. A booking alone does not count; a completed $0 membership-credit or redemption visit does.
- Blended CAC — customer acquisition cost: ad spend ÷ converted clients, what it cost to win each new client.
- Collections (horizon) — total collections those converted clients generated, measured over the selected horizon. It is money actually paid, the same cash figure as sales on the Sales Dashboard: card, cash and bank payments on the day they were paid, with tips and card convenience fees left out. A visit paid with membership credit, a gift card or a comp adds nothing, and membership payments count when they are charged. Sales tax is left out. See collections.
- Blended ROAS (horizon) — return on ad spend: those collections divided by ad spend, as a multiple (e.g. 12.3×).
The CAC and ROAS tiles spell out the name and formula under the figure, and hovering a CAC or ROAS column heading in the tables below shows the same definition.
These tiles are a lead-vintage view: leads are grouped by the date range in which they were captured, and their conversions and collections reflect what those same leads have gone on to do through today — not only what happened inside the date range. A recent month's converted count and collections therefore keep rising for a while as more of its leads come back for a first visit; older months are fully settled.
Compounding Collections
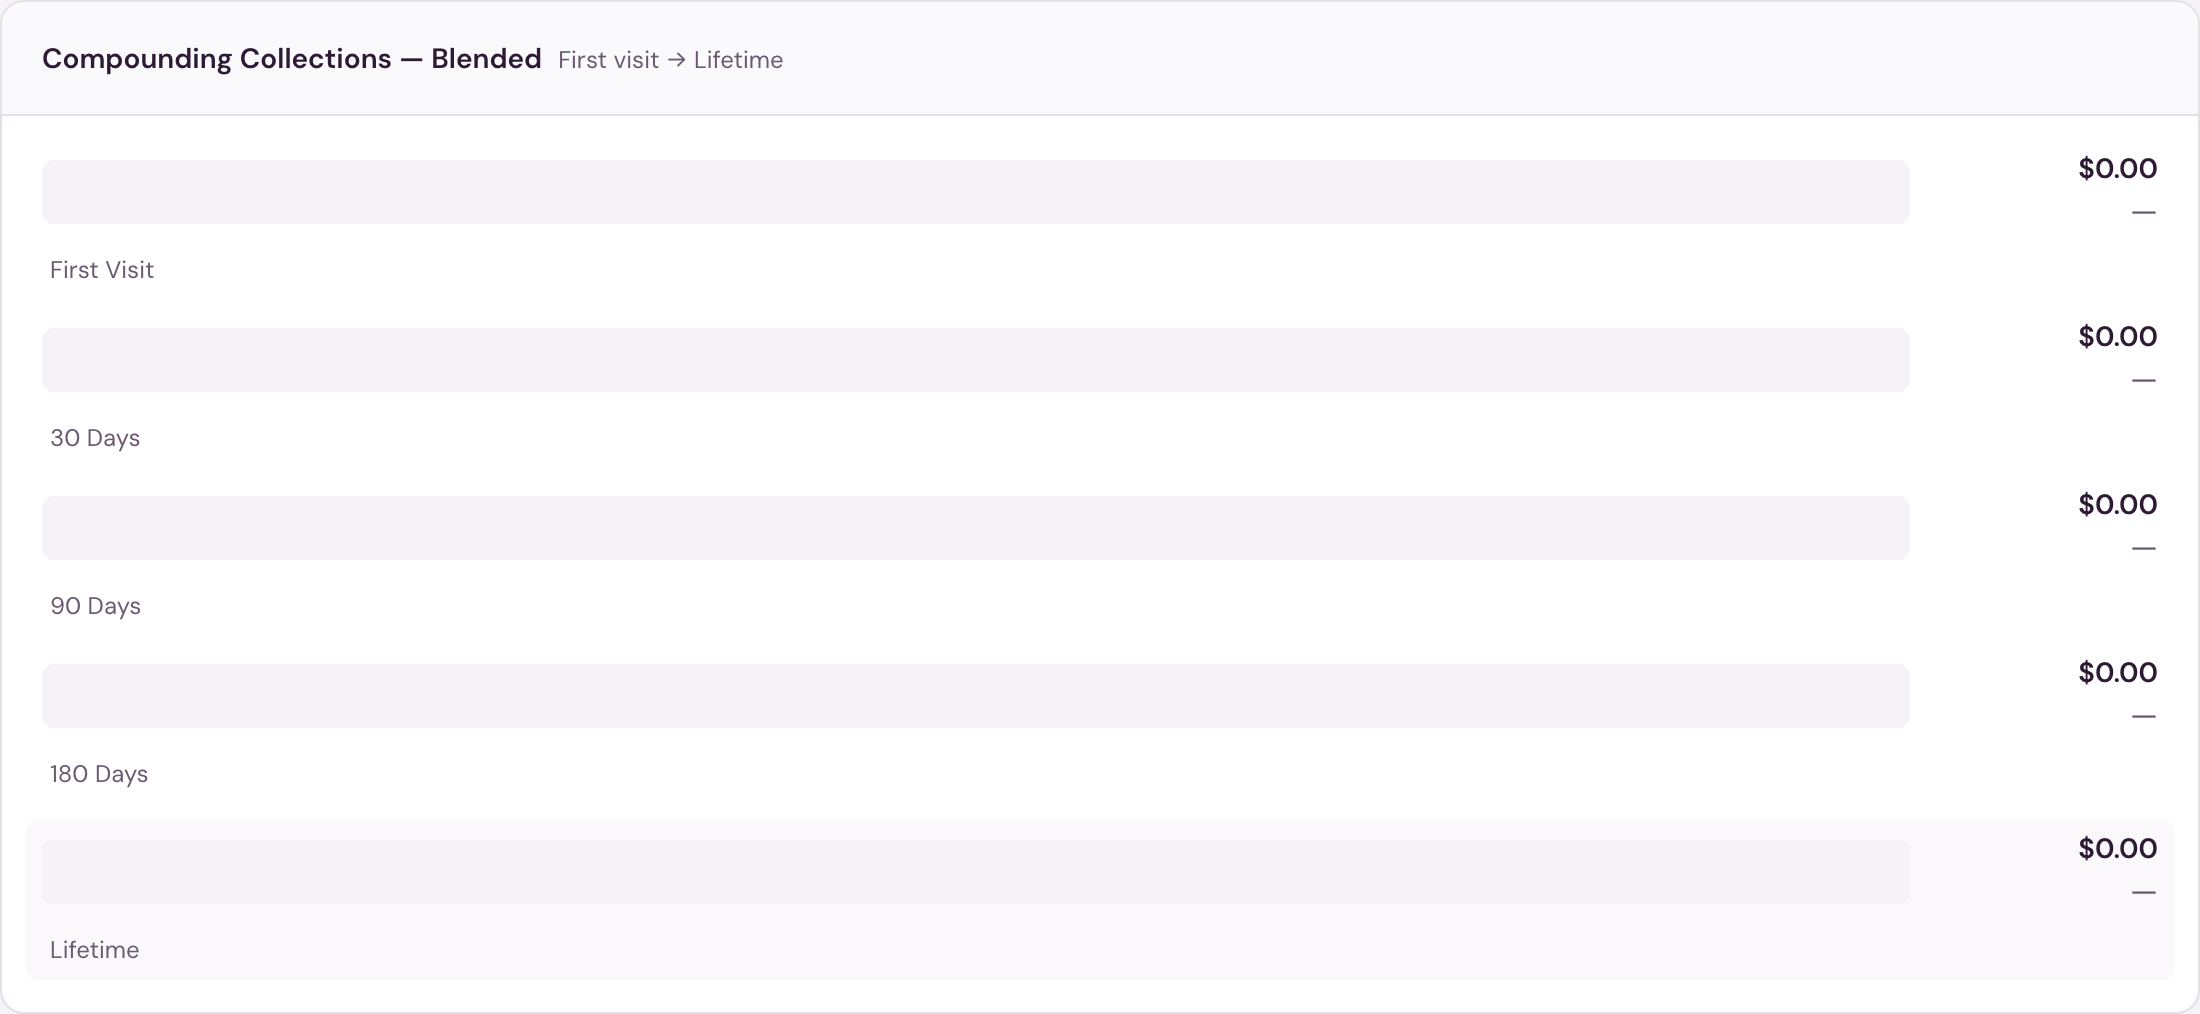
Below the KPI tiles, the Compounding Collections — Blended bars show the same cohort of converted clients at each collections horizon — first visit, then 30, 90, and 180 days, then lifetime — so you can watch a single period's ad spend keep earning as those clients return. Each bar carries the cohort's accumulated collections, with the ROAS multiple at that horizon alongside. Recent horizons a cohort hasn't reached yet simply show $0 until enough time has passed.
Channel Breakdown
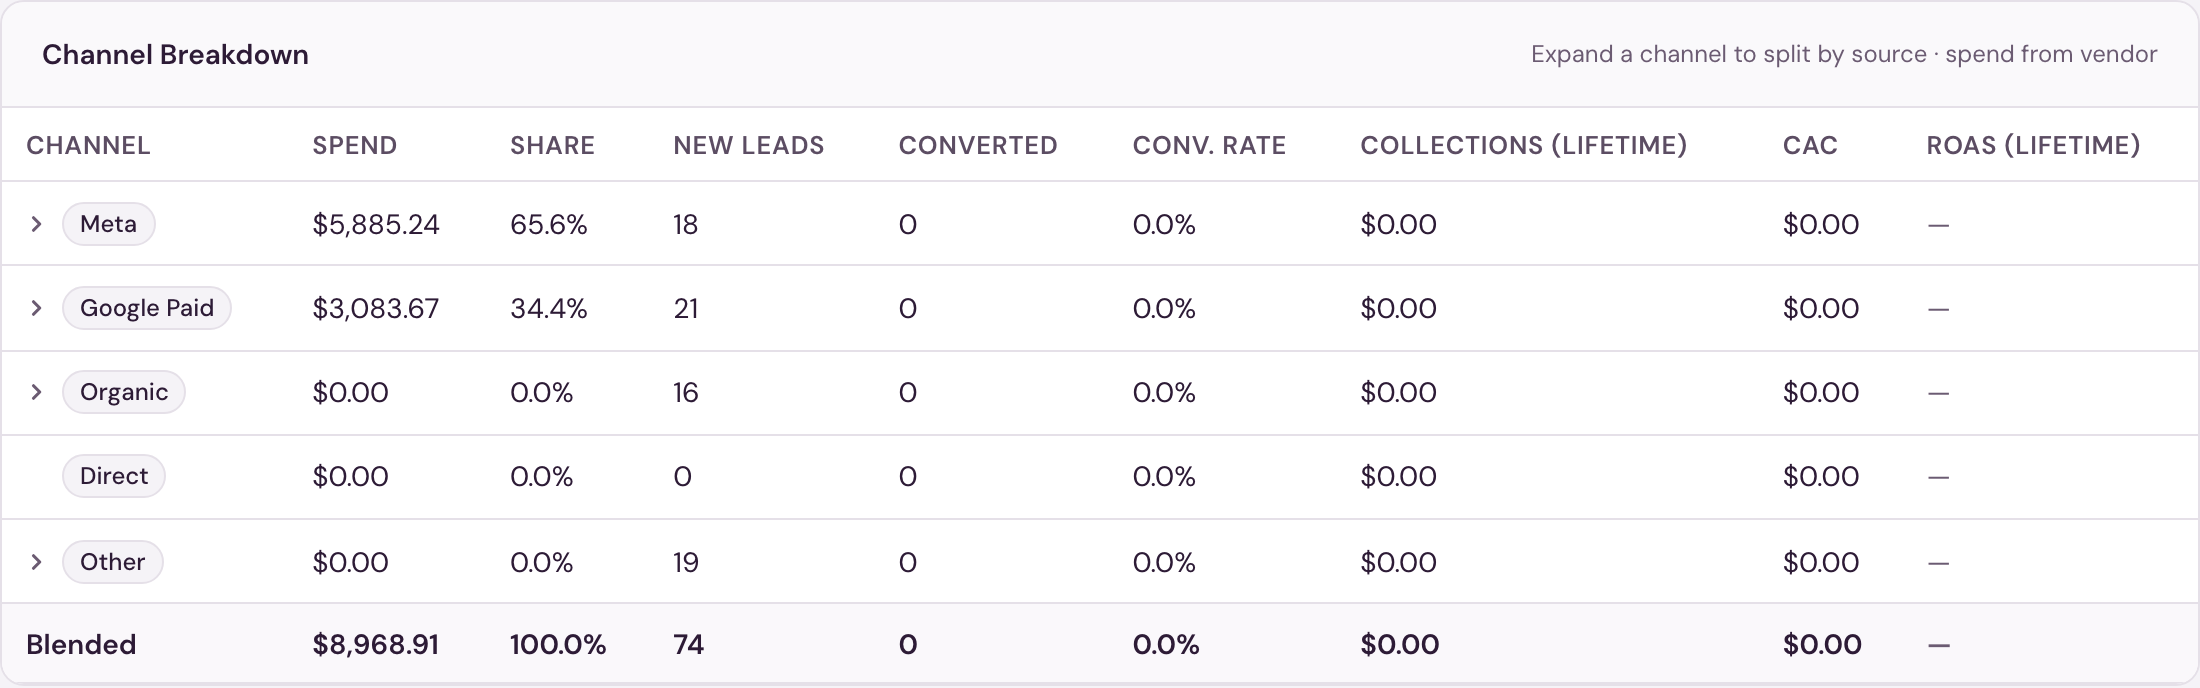
Further down the page, the Channel Breakdown table splits the same numbers out by channel, in a fixed order: Meta, Google Paid, Organic, Direct, and Other, with a Blended total row at the bottom. Only the two paid rows carry ad spend — Organic, Direct, and Other always show $0 spend, since there's no ad cost behind them. A large Organic row is good news; a large Other row points to leads whose source couldn't be determined. Expand a channel to split it further by the individual source underneath (spend shown as reported by that ad platform).
Audience Breakdowns
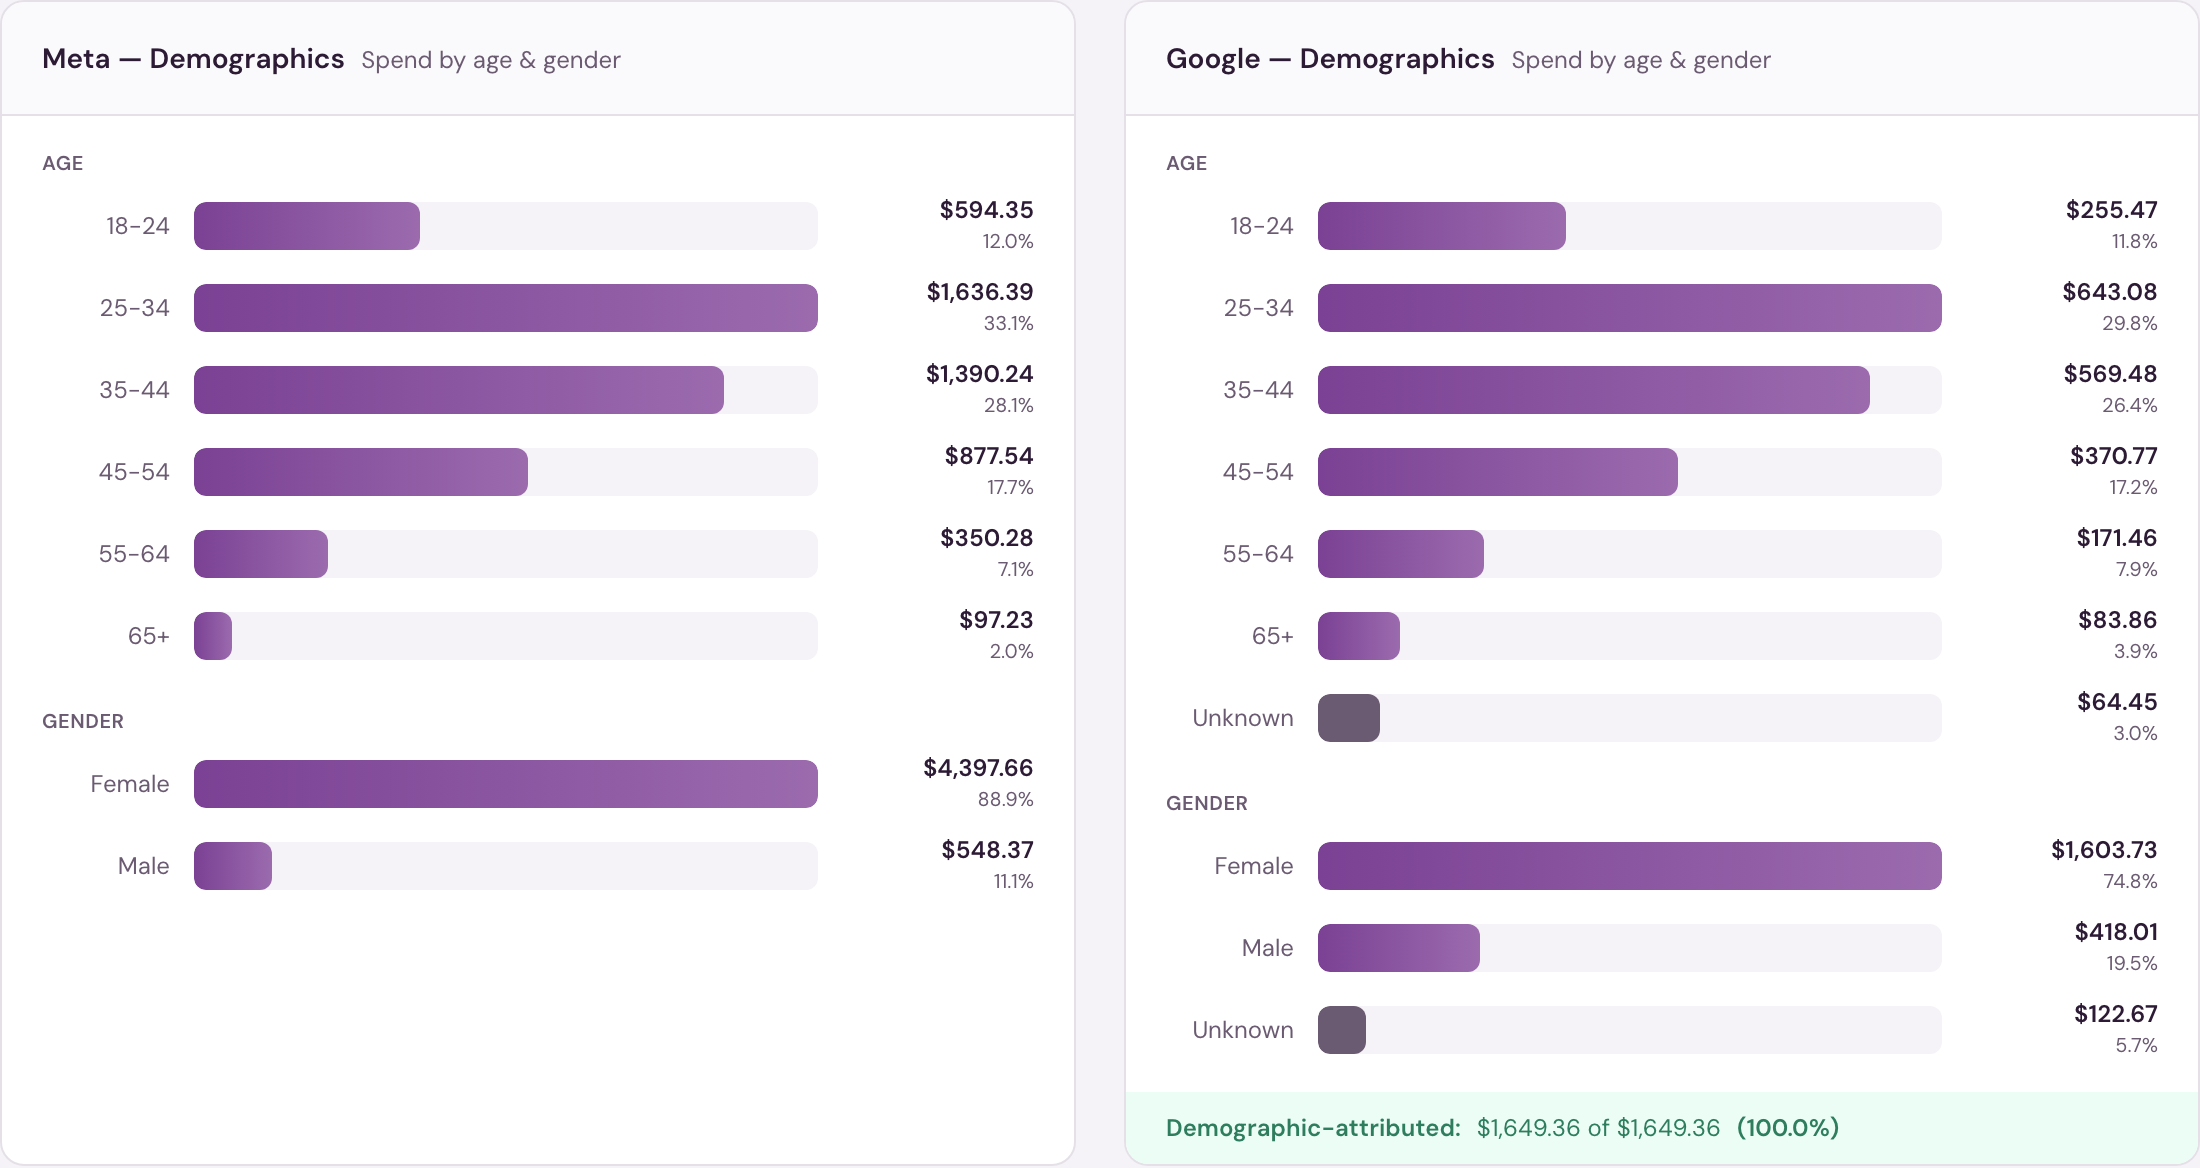
Beyond the Channel Breakdown, an Audience Breakdowns section breaks down ad spend by age and gender for each connected channel — Meta and Google side by side, in the same format, so they read as one comparison instead of two different tools.
Campaign-level detail — per-campaign ROAS, the creative leaderboard, and placement/device breakdowns — lives on each channel's own page now, under Full-Funnel ROAS: see Meta Ads and Google Ads.
Converted Clients
At the bottom of the page, the Converted Clients table is the per-client drill-down behind the headline numbers — every prospect who completed a non-cancelled visit after inquiring, one row each. Columns show the Client, the Source and Campaign that brought them in, their First Visit date, Days to Convert (from inquiry to first visit), and Collections (Lifetime). Click any column header to sort; it opens sorted by lifetime collections, highest first.
A Win-back badge next to a client's name means this conversion brought back a past client who had lapsed, rather than someone brand new — useful for seeing which campaigns are good at re-engaging former clients versus attracting first-timers.

Over a wide date range the table shows the top converters by collections rather than all of them — a footer says how many of the total you're seeing, and sorting only reorders those rows. To see the rest, narrow the date range.
Why the numbers are deliberately conservative
Two kinds of inquiry are deliberately left out of New Leads and the numbers built on it:
- Existing customer — the person had already visited or paid in the six months before they inquired, so this is re-engagement rather than a new customer.
- Repeat inquiry — the same person inquiring again before they booked. The first inquiry already carries the conversion and the collections, so nobody is counted twice.
When any inquiries were excluded, a note under the New Leads tile shows the breakdown — for example, "11 excluded — 1 existing customer, 10 repeat inquiries." The note doesn't appear when nothing was excluded.
A returning regular who happens to click an ad can't inflate a campaign's results — you're only credited for genuinely new business. Expect these numbers to generally read lower than Meta's or Google's own reporting: the platforms count broadly (views, cross-device credit), while this measures new clients won. The same applies to lead reports inside your booking system — those typically count every inquiry and conversion without excluding repeat inquiries or existing clients, so their totals will usually run higher than the deliberately conservative numbers here.
When a source needs attention
A notice at the top of the page lists any of Meta Ads, Meta lead forms, Google Ads or call tracking that isn't updating or isn't connected for the salon, for example "Meta Ads isn't updating for this salon." Meta lead forms covers the leads people submit in a form on a Facebook or Instagram ad: they reach DART only through the salon's connected Facebook page. While the notice shows, ad spend, leads or calls from that source may be missing, so results on this page can read low. Contact your administrator for the details and the fix. The notice goes away on its own once the source is working again.
Salons that share advertising
Some salons advertise together. When the salon you have selected is one of them, this page shows the group combined: ad spend, leads, sales and results for all of the salons together. A note at the top of the page names the salons. Choosing any salon in the group shows the same combined page.
Marketing Health appears under Marketing Analytics once Marketing Analytics is turned on for your salon, for corporate and admin users and staff with the Marketing Dashboard Access permission. There is nothing to configure. A marketing partner login sees Marketing Analytics for the salons assigned to that partner, and nothing else.