Meta Ads
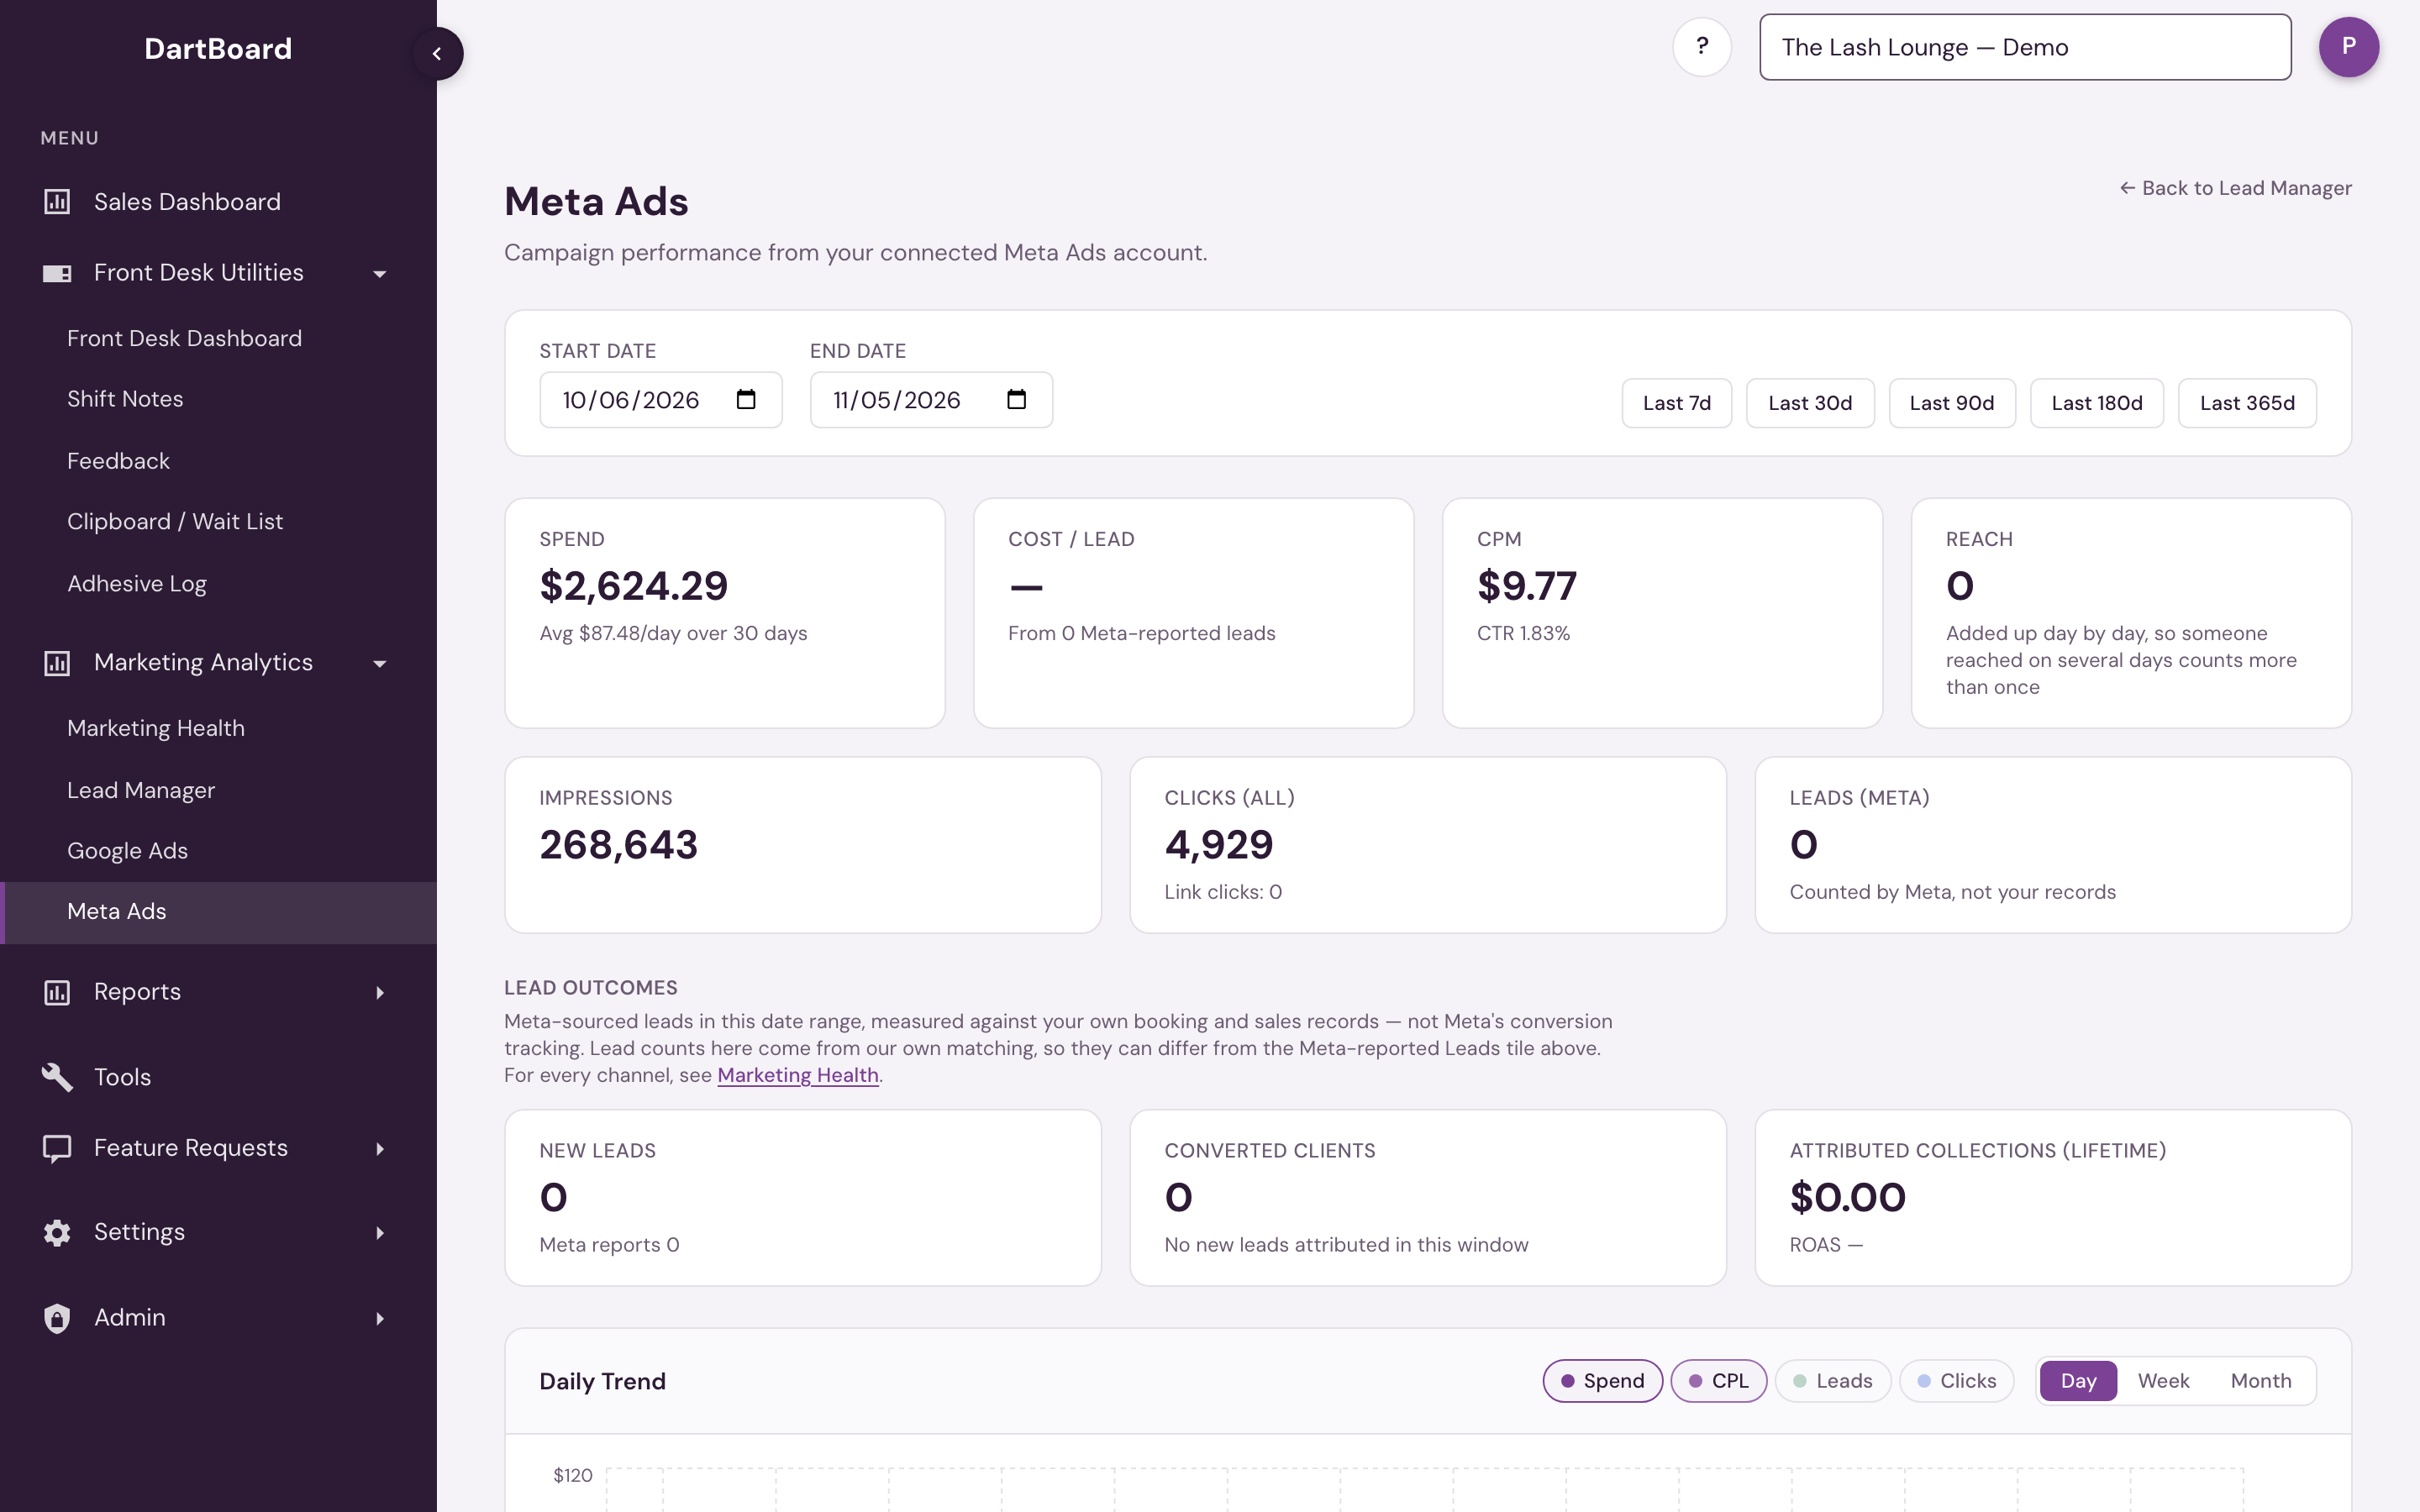
Meta Ads (Marketing Analytics → Meta Ads) shows campaign performance pulled directly from your connected Meta Ads account (Facebook / Instagram) for your selected brand and date range.
Meta spend reporting starts 1 January 2026. Earlier spend isn't reported, so a date range beginning before 2026 returns only the part from January 2026 onward.
Meta lead history has a separate, tighter limit: 90 days from your connection date. Meta only provides the most recent 90 days of leads when an account is first connected, so if you linked Meta recently, leads in these reports may begin later than the spend figures beside them.
 123
Date controls
Pick a custom Start date / End date, or use the Last 7d / 30d / 90d / 180d / 365d quick presets. Everything below — tiles, trend, campaigns table, and breakdowns — reflects this window.

KPI tiles
- Spend — total Meta spend in the window, with average spend per day underneath.
- Cost / Lead — cost per Meta-reported lead.
- CPM — cost per thousand impressions, with CTR alongside it.
- Reach — people reached, added up day by day, so someone reached on several days counts more than once.
A second row covers volume: Impressions, Clicks (all) with your link clicks underneath, and Leads (Meta). Clicks (all) counts every click on your ads, including likes and expanding the text; link clicks are the clicks that went to your website or form, the figure the funnel uses. The Leads (Meta) count comes from Meta's own tracking.
A Lead Outcomes row measures what those leads went on to do, against your salon's own booking and sales records rather than Meta's own conversion tracking:
- New Leads — the same lead count used by Marketing Health, after existing customers and repeat inquiries are excluded.
- Converted Clients — how many of those New Leads completed a non-cancelled visit, shown as both a count and the full arithmetic (for example, “3 of 32 new leads · 9.38%”). A completed $0 membership-credit or redemption visit counts; a booking alone does not.
- Attributed Collections (Lifetime) — what those converted clients have spent since, with ROAS (return on ad spend) underneath.
Where there isn't enough information to calculate a number yet, a tile shows a dash with a short reason rather than a zero — an unknown result and a genuine zero never look the same.
Daily Trend
A Daily Trend chart plots Spend, CPL (cost per lead), Leads, and Clicks by day, week, or month — toggle which lines and which granularity you want.
A Funnel runs from impressions to reach, link clicks, landing page views and leads. Each step shows its share of the step above, except Leads, which is compared with link clicks, because leads from Meta's instant forms never visit a landing page.
Campaigns table
Below the trend, every campaign in the period is listed with Status, Objective, Daily Budget, Spend, Impressions, Reach, Clicks, CTR, CPM, Leads (Meta), Cost / Lead, Converted (our records), and ROAS (Lifetime). Leads (Meta) is Meta's own count. The last two columns are Meta's only campaign-level tie into your actual client outcomes — they use the same lead-to-client matching as Marketing Health, tied to each campaign wherever a lead can be matched to it. Click a campaign row to expand it and see the ads underneath.

Breakdowns
A collapsible Breakdowns section (open by default) covers where results come from: a Platform donut (Facebook vs. Instagram, Feed vs. Stories vs. Reels), a Demographics heatmap (age × gender), and an Hour of day heatmap for spend or impressions, added up across the selected dates. Point to or tap an hour to see its impressions, spend and clicks. Hour of day covers up to 60 days: on a longer range it shows the last 60 days and says Last 60 days next to the title.
Full-Funnel ROAS
Further down the page, a Full-Funnel ROAS section — with its own Include collections through control — goes deeper on the same real-outcomes data as Marketing Health, scoped to Meta and broken out further:
- Meta — Campaign ROAS — every campaign, sortable by the collections it actually drove over the selected horizon.
- Creative leaderboard — your ads ranked by ROAS, then new leads, then spend, with new leads, cost per new lead, CTR, CPM and video stats, and Meta's own quality, engagement and conversion rankings. Meta only ranks an ad once it has enough impressions; until then it shows Not rated. The top 15 show first; Show all lists the rest.
- Placement breakdown — how your Meta spend splits across placements such as Facebook Feed, Instagram Stories and Reels.
- Device breakdown — how your Meta spend splits across devices, such as mobile and desktop.
This detail sits here so campaign-level outcomes are next to the platform data (spend, impressions, clicks) they're built on top of.
How this differs from Marketing Health
This page separates what Meta knows — impressions, clicks, spend, and Meta-counted leads — from Lead Outcomes, which uses your booking and sales records. Marketing Health uses those same first-party New Leads, Converted Clients, and collections definitions across Meta and Google together.
Salons that share advertising
Some salons advertise together. When the salon you have selected is one of them, this page shows the group combined: ad spend, leads, sales and results for all of the salons together. A note at the top of the page names the salons. Choosing any salon in the group shows the same combined page.
Same access as the rest of Marketing Analytics: Marketing Analytics must be turned on for your salon, and you need to be a corporate or admin user or have the Marketing Dashboard Access permission. Ad data updates automatically every day.