Franchise Performance
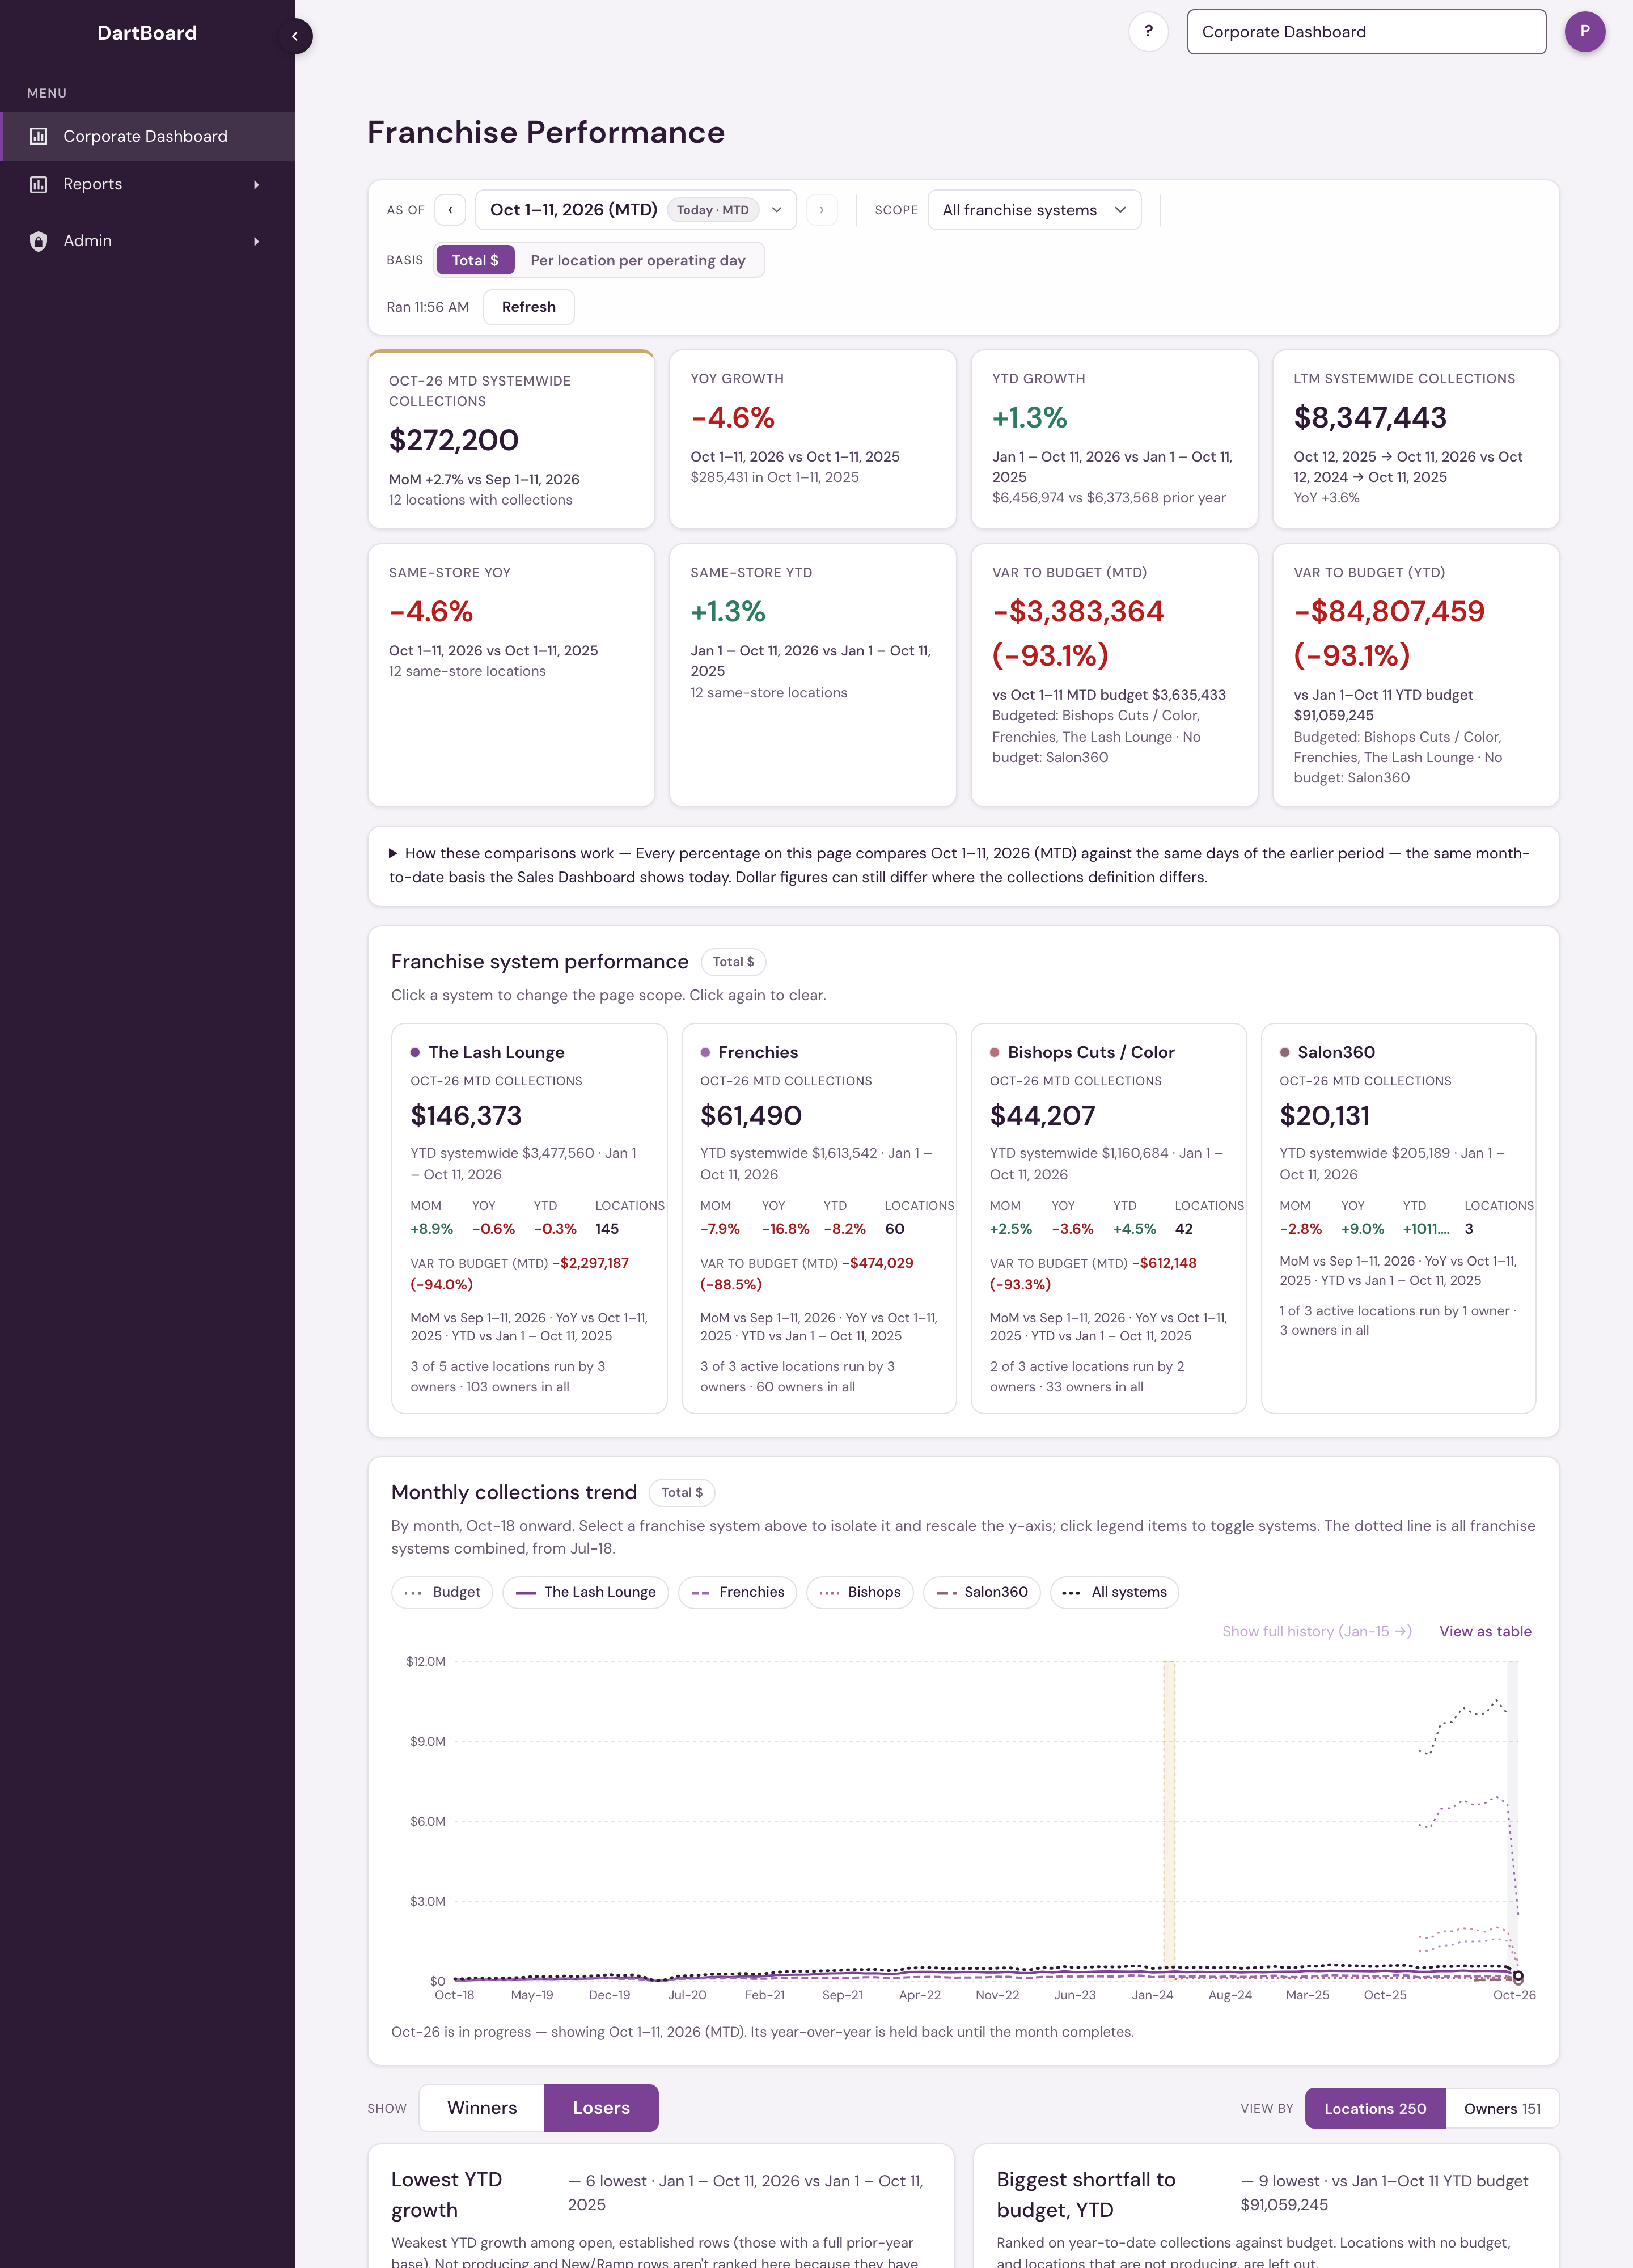
Franchise Performance is a franchisor-level dashboard. Corporate staff, corporate admins included, open it as the Corporate Dashboard — it is the first page they see after signing in, and it stays pinned at the top of the salon switcher. Platform admins open it from the same Corporate Dashboard entry. It shows how the franchise systems in your access scope are performing — collections for the period you choose, growth against last month and last year, year to date, the last twelve months, and leaderboards ranked by location or by owner.
Use the system cards or the Scope selector to focus on a single system. The search and flag controls filter the detail rows only; they never change the totals above them.
Choosing your reporting date
The As of control at the top of the page sets the date everything on the page runs through.
The dashboard opens on the current month so far, so you can check the business at any point in the month without waiting for it to end. From the As of control you can:
- Click a month to see that month complete, start to finish.
- Pick a specific day to see the month up to that day — useful for looking back at where you stood on the same date in a past month.
- Choose "Today (MTD)" at any time to return to the current month so far.
Whichever date you choose, every section of the page moves with it together: the tiles, the leaderboards, the detail table, the trend, and the export.
The page's web address keeps the date you chose along with the rest of your view: the franchise system, Locations or Owners, the total or per-location-day view, the label filter and the search. Reloading the page brings back the same view, and a copied link opens it for whoever you send it to. A link only shows the franchise systems the person opening it has access to.
Mid-month comparisons are like-for-like
When you are looking at a partial month, the comparisons are cut to match. If it is the 13th, the dashboard compares your first 13 days against the first 13 days of last month and the first 13 days of the same month last year — never against those full months. A month in progress is never shown as though it were finished, and never compared against a finished one.
Each tile names the exact window it covers, so you can always see what is being compared with what.
How current the numbers are
Payment data arrives from your booking and payment systems on a delay, usually completing overnight. The dashboard reads through the most recent day that is fully in, which is normally yesterday. The As of control tells you which day that is, and will not let you pick a day the data has not reached yet.
If a system's data is further behind than the rest, that system's own sections say so and show its own reporting date rather than quietly borrowing the date from the others. A system that has not yet reported any collections at all stays selectable as a roster-only view: you can still see its locations and counts, and performance figures show as dashes rather than zeros, because no sale has been recorded — not because a sale was zero.
How the labels are decided
Each row is labelled Outperforming, Growing, Softening, Needs Help, New/Ramp or Not producing. The first four are based on year-to-date growth. Not producing means a location with no day of positive collections in the last 30 days.
These labels are always graded on complete months only, even when you are viewing the month so far. A few days of collections is not enough to judge whether a business is trending up or down, and a label that changed every morning would not be worth reading. The legend on the page names the month the labels are based on — mid-August, for example, they are graded through the end of July.
The labels are descriptions, not filters. A location's collections are always counted in the totals no matter which label it carries.
Reading the trend
The trend chart shows the last 30 months. When you are viewing a month in progress, that month appears at the end of the line drawn as a dashed segment with an open dot, marking it as still filling in. Its year-over-year comparison is held back until the month finishes, so a part-month is never scored against a full one.
What counts as collections
Collections are the real money taken, after tax and tips are removed. For The Lash Lounge, that's card payments, excluding tips, less the tax on those payments and less any card convenience fee the location charges. It is the same figure as Roll Up Sales with Include CC Fees off.
Collections are the real money paid by card, cash, check or custom payment, with sales tax and tips left out. For Frenchies studios that is Net Collections on the point of sale's KPI report less the sales tax collected.
Because each booking system defines this in its own terms, figures here can differ slightly from other reports that count money differently. The dashboard always states which definition it is using.
Same-store growth (Same-store YoY and Same-store YTD) compares only locations that recorded collections in both periods being compared, so a location that opened or went quiet partway through does not distort the change. It does not claim a location traded continuously or has been open a particular number of months. This comparison is always shown alongside total collections, never instead of it.
Historical collections are grouped under each location's current owner. If you change an owner mapping, the history regroups accordingly — it is not split between the old and new owner.
What is included
Collections count in the month they were paid, for active and inactive locations alike. A location marked Active does not necessarily have recent collections, and closing a location does not remove what it collected earlier. The leaderboards and the detail table rank one level at a time, chosen with the View by switch (Locations or Owners, each with its count) shown above the leaderboards and again in the table's filter bar. Locations (the default) makes every location its own row. The first column shows the location name, and under it a smaller grey line with the owner — the multi-unit owner's name, or the location's contact name when it isn't assigned to an owner yet — and the franchise system with its coloured dot. That is where "top location" and "bottom location" live. Owners ranks one row per owner: the first column shows the owner's name, and under it the number of locations and the franchise system. An owner who owns several locations sums them, and an owner who owns one appears as a one-location row. Only locations with no owner on record at all are left out (the row count says how many); they belong to the Locations view. So a single-location owner is still an owner, but a location never competes as if it were one. That is where "top owner" and "bottom owner" live. Neither view changes a total. Map owners under Settings → Corporate Settings → Franchise Management → Multi-Unit Owners. The first column also holds the arrow that opens a row for its full trend. When a single franchise system is chosen in Scope, the system is left out of the caption because every row belongs to it. Search matches both location and owner names. The CSV export carries Location, Owner and Franchise system as separate columns, and the As of, Scope and Basis controls stay docked under the header as you scroll.
A dash means there is no value to show. A zero means the source genuinely reported zero. Negative collections can happen when refunds exceed payments in a period, and are left negative rather than rounded up to zero.
Budget
Two Var to Budget tiles — MTD and YTD — sit alongside the other tiles. On the All Systems view each is the combined variance across every system that has a budget loaded, and its caption names which systems are in the total and which have no budget for the window. Narrow the Scope selector to a single franchise system and the tiles show that system against its own target.
Each system card also carries a Var to budget (MTD) line, so you can compare systems against their targets at a glance without changing scope. A card without the line belongs to a system with no budget for the current month.
The tiles are variance-led: each headline is Var to Budget, in dollars and percent, one for month to date and one for year to date. They follow the page's own As of control, so the budget and the collections it's compared against always cover the exact same days — pin As of to the 13th and both sides stop on the 13th.
Budget by location and by owner. Below the tiles, the detail table carries the variance to budget for the month to date and the year to date: Var % MTD, Var $ MTD, Var % YTD and Var $ YTD, each with its dates under the heading. It covers every location in the chosen system, and the Owners view shows the same figures for each owner, added up from their locations that have a budget. A location with no budget shows a dash and is left out of its owner's figures, so its collections never count as beating a budget; an owner with no budgeted location shows a dash. Var $ is in whole dollars, and both are signed and coloured like the growth columns (green above budget, red below). The table's columns run the first column (location or owner), Collections, YoY %, YTD %, MoM %, Var % MTD, Var $ MTD, Var % YTD, Var $ YTD, LTM collections, Trend and Flag. The budget amounts themselves are in the opened row and in the CSV export. Budget that is loaded for a system but is not matched to any location (planned openings) is listed on its own row at the foot of the table, so the budget adds up to the system's. In the Owners view, locations with no owner on record are not listed as rows, so that row also carries their budget, collections and variance, and its name says so. The variance column does not add up to the Var to Budget tiles: the tiles count every location's collections, and the rows count only collections at locations with a budget. In a window narrower than 1,280 pixels the table leaves out LTM collections and the Trend line so the remaining columns fit; open a row to see both, and the export always includes them.
Ranked lists. A Winners | Losers switch next to View by shows two year-to-date cards at a time, and it opens on Losers. Losers shows Lowest YTD growth (rows with negative growth, lowest first) and Biggest shortfall to budget, YTD (rows below their year-to-date budget, furthest below first). Winners shows Highest YTD growth (rows with positive growth, highest first) and Biggest beat on budget, YTD (rows at or above their year-to-date budget, furthest above first). A Rank by $ | % switch beside it picks the measure for both cards, and it opens on $. % ranks on percent change, so a small location counts as much as a large one. $ ranks on dollars: the growth cards on year-to-date collections minus the same dates last year, the budget cards on dollars above or below the year-to-date budget. A location that falls 100% on $12,000 a year ranks above one that falls 5% on $10 million under %, and below it under $. Each row shows the other measure in its caption, and dollars follow the Basis, so Per location per operating day ranks on dollars per location-day. The CSV export carries the year-to-date dollar change as YTD $ change. Both measures rank the same rows. The growth cards rank open, established rows with a full prior-year base, so Not producing and New/Ramp rows are left out. The budget cards rank on how far each row is from its year-to-date budget, and leave out rows with no budget and rows that are not producing; a producing location with negative collections stays in. Each card shows how many rows qualify (up to 20) and the dates it covers, and an empty card says so. Under the shortfall card's rows, a line such as 3 locations not producing: −$12,400 to budget, year to date adds up what the left-out Not producing rows were budgeted for and missed, counting only rows with a year-to-date budget above $0; it is shown only when there are such rows, and selecting it shows exactly those rows in the detail table (Not producing, with a year-to-date budget) and jumps to the table; the Not producing chip shows every Not producing row. Select a row in a card to show that row in the detail table, with its name in the search box, and jump to the table; editing the search box searches by name again. Both switches stay as you change View by, the system, the Basis or the month. A growth figure that rounds to zero shows as 0.0%, never -0.0%.
Budget on the trend. The monthly collections trend draws a dotted Budget line for every month that has a budget loaded. The line follows whichever systems are shown and has no switch of its own. Months without a budget draw no line.
Budgets are loaded for the current year, so prior-year comparisons have no budget to compare against.
A blank tile means either no budget is loaded for that system over that window, or the window is only partly budgeted — never that the budget is zero.
Why this may differ from Weekly PE Summary
Franchise Performance and the Weekly PE Summary report read the same collections (the definition described above) and the same budget, and they apply the same rules for blank budget cells and All Systems totals. The one thing they do differently is where the count stops. This dashboard counts completed days only, which normally means through yesterday. Weekly PE Summary counts every sale through the end of the range you picked, today included. For a range that ends today or yesterday the two figures can therefore differ; for a range that has fully passed they match.
Total and per-location-day views
Total $ shows reported dollars. Per location per operating day divides collections by the number of location-days that actually recorded collections, which is the fairer way to compare systems or owners of different sizes.
The toggle moves everything together — table values, sorting, leaderboard ranking, growth percentages and the sparklines. It is based on days that recorded collections, not on calendar days or scheduled opening hours.
Available to corporate staff (corporate admins included), PE Group users and platform admins through the Corporate Dashboard entry in the salon switcher. Corporate staff see the franchise systems they are assigned to; PE Group users see the systems they were added to. Both land here when they sign in — for a PE Group user it is the only page. To work in one salon, choose it in the salon switcher. Salon users don't have access.