Revenue by Employee
Revenue by Employee is the full per-person sales report for a date range, for one location or for several at once. It mirrors the Sales Dashboard's Average Stylist Revenue breakdown, with one important difference:
No one who sold anything is dropped for having zero visits.
The dashboard table only lists team members who had attended service visits in the period. But someone can ring up retail without performing a single service — a front-desk team member selling product at checkout, for example. This report includes them, with their retail clearly counted. (Staff who neither performed a service nor rang up retail in the period still don't appear.)
Finding it: open Reports → Salon Reports → Staff Performance and click View Report on the Revenue by Employee card.
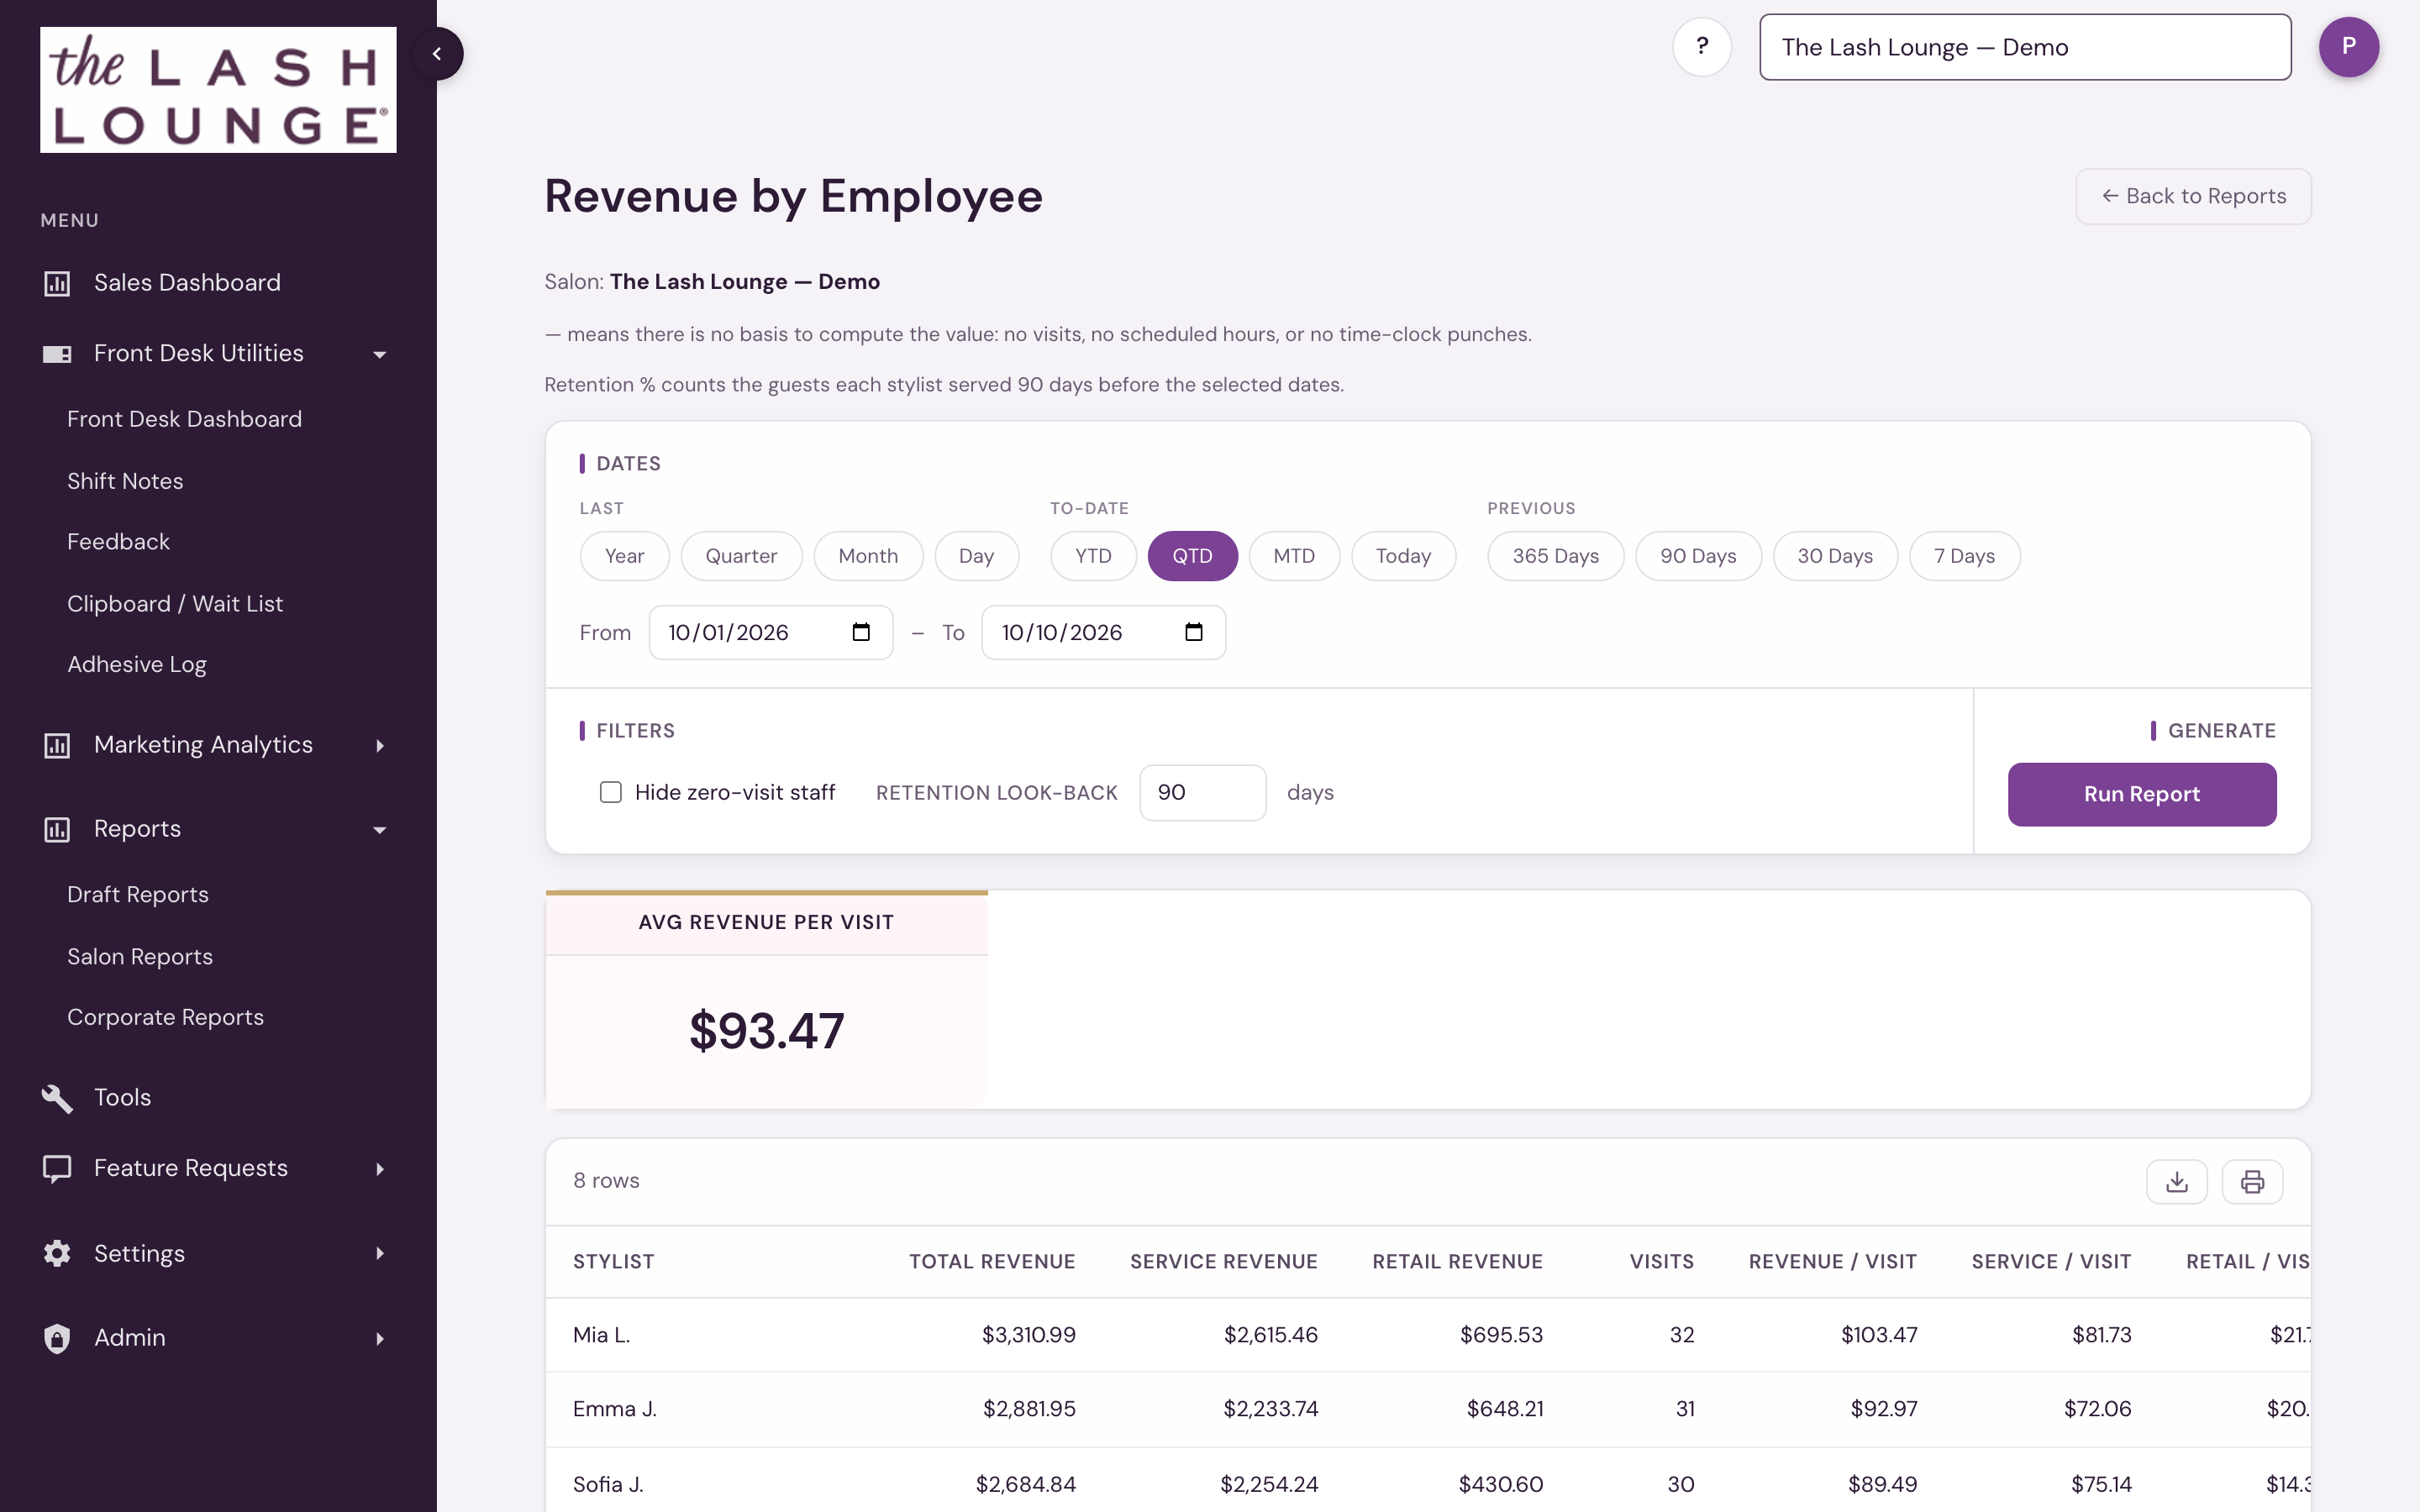
Running the report
The report opens on the location selected in the top-right switcher. Pick a start and end date (defaults to the current month), set the Retention look-back if you want something other than 90 days, and click Run Report. Nothing runs until you click it. Switching the top-right switcher while the report is open clears the table and puts the report back on the newly selected location; click Run Report again.
If no location is selected in the switcher, the report shows a prompt to pick one instead of a table.
Several locations at once
If you have access to more than one location, the filters include a Locations list. It starts with the switcher's location ticked. Tick the locations you want, or All Locations, and click Run Report.
- The list shows the locations you have access to in the same franchise system as the switcher's location. To run another system, choose one of its locations in the switcher.
- The table has one row per team member per location, with the location's name in the first column. Someone who works at two locations has two rows; their figures are not added together.
- Every row is the same as the row that location's own report shows for the same dates.
- Click the first column's heading to group the rows by location, or any other heading to rank team members across all of the locations.
- A location with no sales in the dates has no rows. It still counts in the number of locations shown above the table.
- If a location's figures can't be shown, a line above the table names it. Run the report again to include it.
- A very large request, such as every location over a long date range, can be too big to finish. The report says so; choose fewer locations or a shorter date range.
With one location ticked, the report is the one-location report and has no location column.
Retention look-back
For The Lash Lounge and Bishops, the filters include a Retention look-back box, set to 90 days. It decides which guests the two Retention % columns measure: the guests each stylist served that many days before the dates you selected (see the maturity window).
Type a different number of days (0 to 365) and click Run Report to measure a more recent or an older group of guests:
- A smaller number looks at more recent guests. They have had less time to come back, so the percentages read lower. Use it to see where a stylist is heading, and compare it with another run at the same number, not with the 90-day figure.
- A larger number looks at guests from further back, who have had longer to return.
- 0 measures the guests served in the selected dates themselves.
Only the Retention % columns change; sales, visits and every other column always cover the dates you selected. A line above the table states the look-back the rows were run with, and a CSV exported at anything other than 90 days carries the number in its file name. The Sales Dashboard's Average Stylist Revenue table has the same box; its Salon Health Retention tile always uses 90 days.
Columns
| Column | What it shows |
|---|---|
| Stylist | The team member. |
| Allocation Type (Bishops) | Whether the sale is credited to a team member, or shows as Unassigned because the booking system didn't record who made it. |
| Total Revenue | Everything they sold — service plus retail. |
| Service Revenue | Sales from services they performed. |
| Retail Revenue | Sales from retail product, credited to whoever is recorded as making the sale — so a walk-up product sale rung by the front desk credits the front desk, not whichever stylist happened to be on the ticket. If a product line has no seller recorded, it goes to a stylist who performed a service on that same ticket. |
| Visits | Service visits they attended. |
| Revenue / Visit | Total Revenue ÷ Visits. |
| Service / Visit | Service Revenue ÷ Visits. |
| Retail / Visit | Retail Revenue ÷ Visits. |
| Revenue / Hr | Total Revenue ÷ clocked hours. Shows — when no hours were recorded. |
| $ Service Revenue Per Hour / $ Total Revenue Per Hour (Frenchies) | Service sales, and total sales, ÷ hands-on service hours. On the studio row the studio's revenue is divided by the service providers' hours, matching Frenchies' own KPI report — see Utilization. |
| Utilization | Of the hours the team member was scheduled, the share spent with guests. Shows — for anyone with no scheduled hours or no service visits. Full definition: Utilization. |
| Rebooking % (The Lash Lounge, Bishops) | Of the guests the stylist served in your date range, the share who left with their next appointment already booked. The next appointment must be with the same stylist, booked on or before the visit date. Shows — when the stylist served no guests. Full definition: Rebooking %. |
| Retention % (New) and Retention % (Existing) (The Lash Lounge, Bishops) | The stylist's client retention rate, shown separately for guests seeing the stylist for the first time and for guests who had seen the stylist before. Retention is measured on the guests served 90 days before your date range (so they've had time to return) unless you change the Retention look-back, and shows — when there's no history old enough yet. |
Bishops adds an Allocation Type column, counts Operational Visits, and shows utilization as two columns — Scheduled Util. and Clocked Util., the second measured against hours actually clocked in.
For Frenchies this report is the same table as Nail It! on the Sales Dashboard: it lists the nail techs who performed services in the dates you picked, and the studio figures above the table cover those same employees, so the rows add up to them. Front-desk, manager and owner sales are not listed here. For whole-studio figures use Studio Health on the Sales Dashboard.
The columns are the same thirteen as Zenoti's Nail It report, in the same order: Employee Name, $ Service Revenue, $ Retail Revenue, $ Total Revenue, Retail % of Services, $ Service Revenue Per Hour, $ Total Revenue Per Hour, $ Total Revenue Per Paid Hour, Average Ticket, Rebooking %, Utilization %, Request % and Star Rating/Feedback. Each is described under Nail It! on the Sales Dashboard. The columns in the table above that are not in this list (tickets, the per-ticket splits and Retention %) are not shown for Frenchies.
For retail-only staff with zero visits, the per-visit columns show —, because there are no visits to divide by. The hours-based columns behave differently on purpose: Revenue / Hr and the utilization columns show —, because dividing by hours nobody recorded would state a performance figure that no data supports. Use the Hide zero-visit staff filter if you only want the service team.
The sales figures are pre-tax and exclude tips, with refunds netted out. Unlike the salon's cash revenue figures, these per-person totals credit the full value of the work performed even when a client pays with membership credit, a gift card, or a prepaid package — so a stylist's number reflects everything they produced, not only the cash that changed hands that day.
A service paid for with a package or a gift card shows the value of the service, not $0. It is counted once: if the service already shows its price, the gift card or package amount isn't added on top. Your collections are separate and don't change.
The KPI card above the table shows the location value, not a sum or average of employee rows — Avg Revenue per Visit, the location's service-and-retail sales divided by its completed visits. It always reflects the full location, so it doesn't change when you hide zero-visit staff.
When the report covers several locations, a second card counts the locations in the table, and the average is all of those locations' sales divided by all of their visits (for Frenchies, tickets). It is not an average of the locations' averages, so a busy location weighs more than a quiet one.
If the numbers behind the card aren't complete yet, the card shows a dash and tells you why, rather than showing $0 as though the number really were zero.
A Hide zero-visit staff checkbox in the filters collapses the table to the dashboard-style view (staff who had at least one visit) — off by default, since including zero-visit sellers is the whole point of this report.
The card shows Avg Ticket instead, counted from the studio's completed sales, and the checkbox reads Hide zero-ticket staff. One ticket can include work from more than one stylist, and when it does it counts for each of them — so adding up the stylists' ticket numbers won't match the studio card. The report says so directly above the table; for the true studio figure, use the card. The Sales Dashboard's Avg Ticket (in the Nail It! table) uses only service providers' sales and tickets, while this card uses the whole studio, so the two can differ. Your CSV download uses whichever wording you see on screen.
When to use which
- Average Stylist Revenue (on the Sales Dashboard) — day-to-day view of stylist production. Front-desk sellers aren't listed, so its retail column totals less than the salon's retail — the gap is front-desk retail.
- Revenue by Employee (this report) — the complete accounting. Every commissioned seller appears, so it foots to the salon's total retail.
Exporting
The download icon above the table exports a CSV respecting the Hide zero-visit staff filter, named for the report, the location and the dates you ran. A file covering several locations is named for the number of locations, and has the location's name and POS ID as its first two columns. The file keeps the exact figures behind the screen — blanks stay blank rather than turning into zeros — and adds a few extra columns, such as who each sale was credited to and how current the figures are, for anyone checking these numbers against another system.
The hourly and utilization columns need staff hours. When a period reaches back before the shop's schedule or time-clock records begin, the figure shows a dash. Revenue and visits are still shown.
Lives in Salon Reports → Staff Performance, which opens to corporate and admin users, and anyone with reporting access at a location that has Reports enabled. It opens on the location selected in the header switcher. Both the switcher and the report's Locations list show only the locations you have access to.