Salon Performance by Marketing Partner
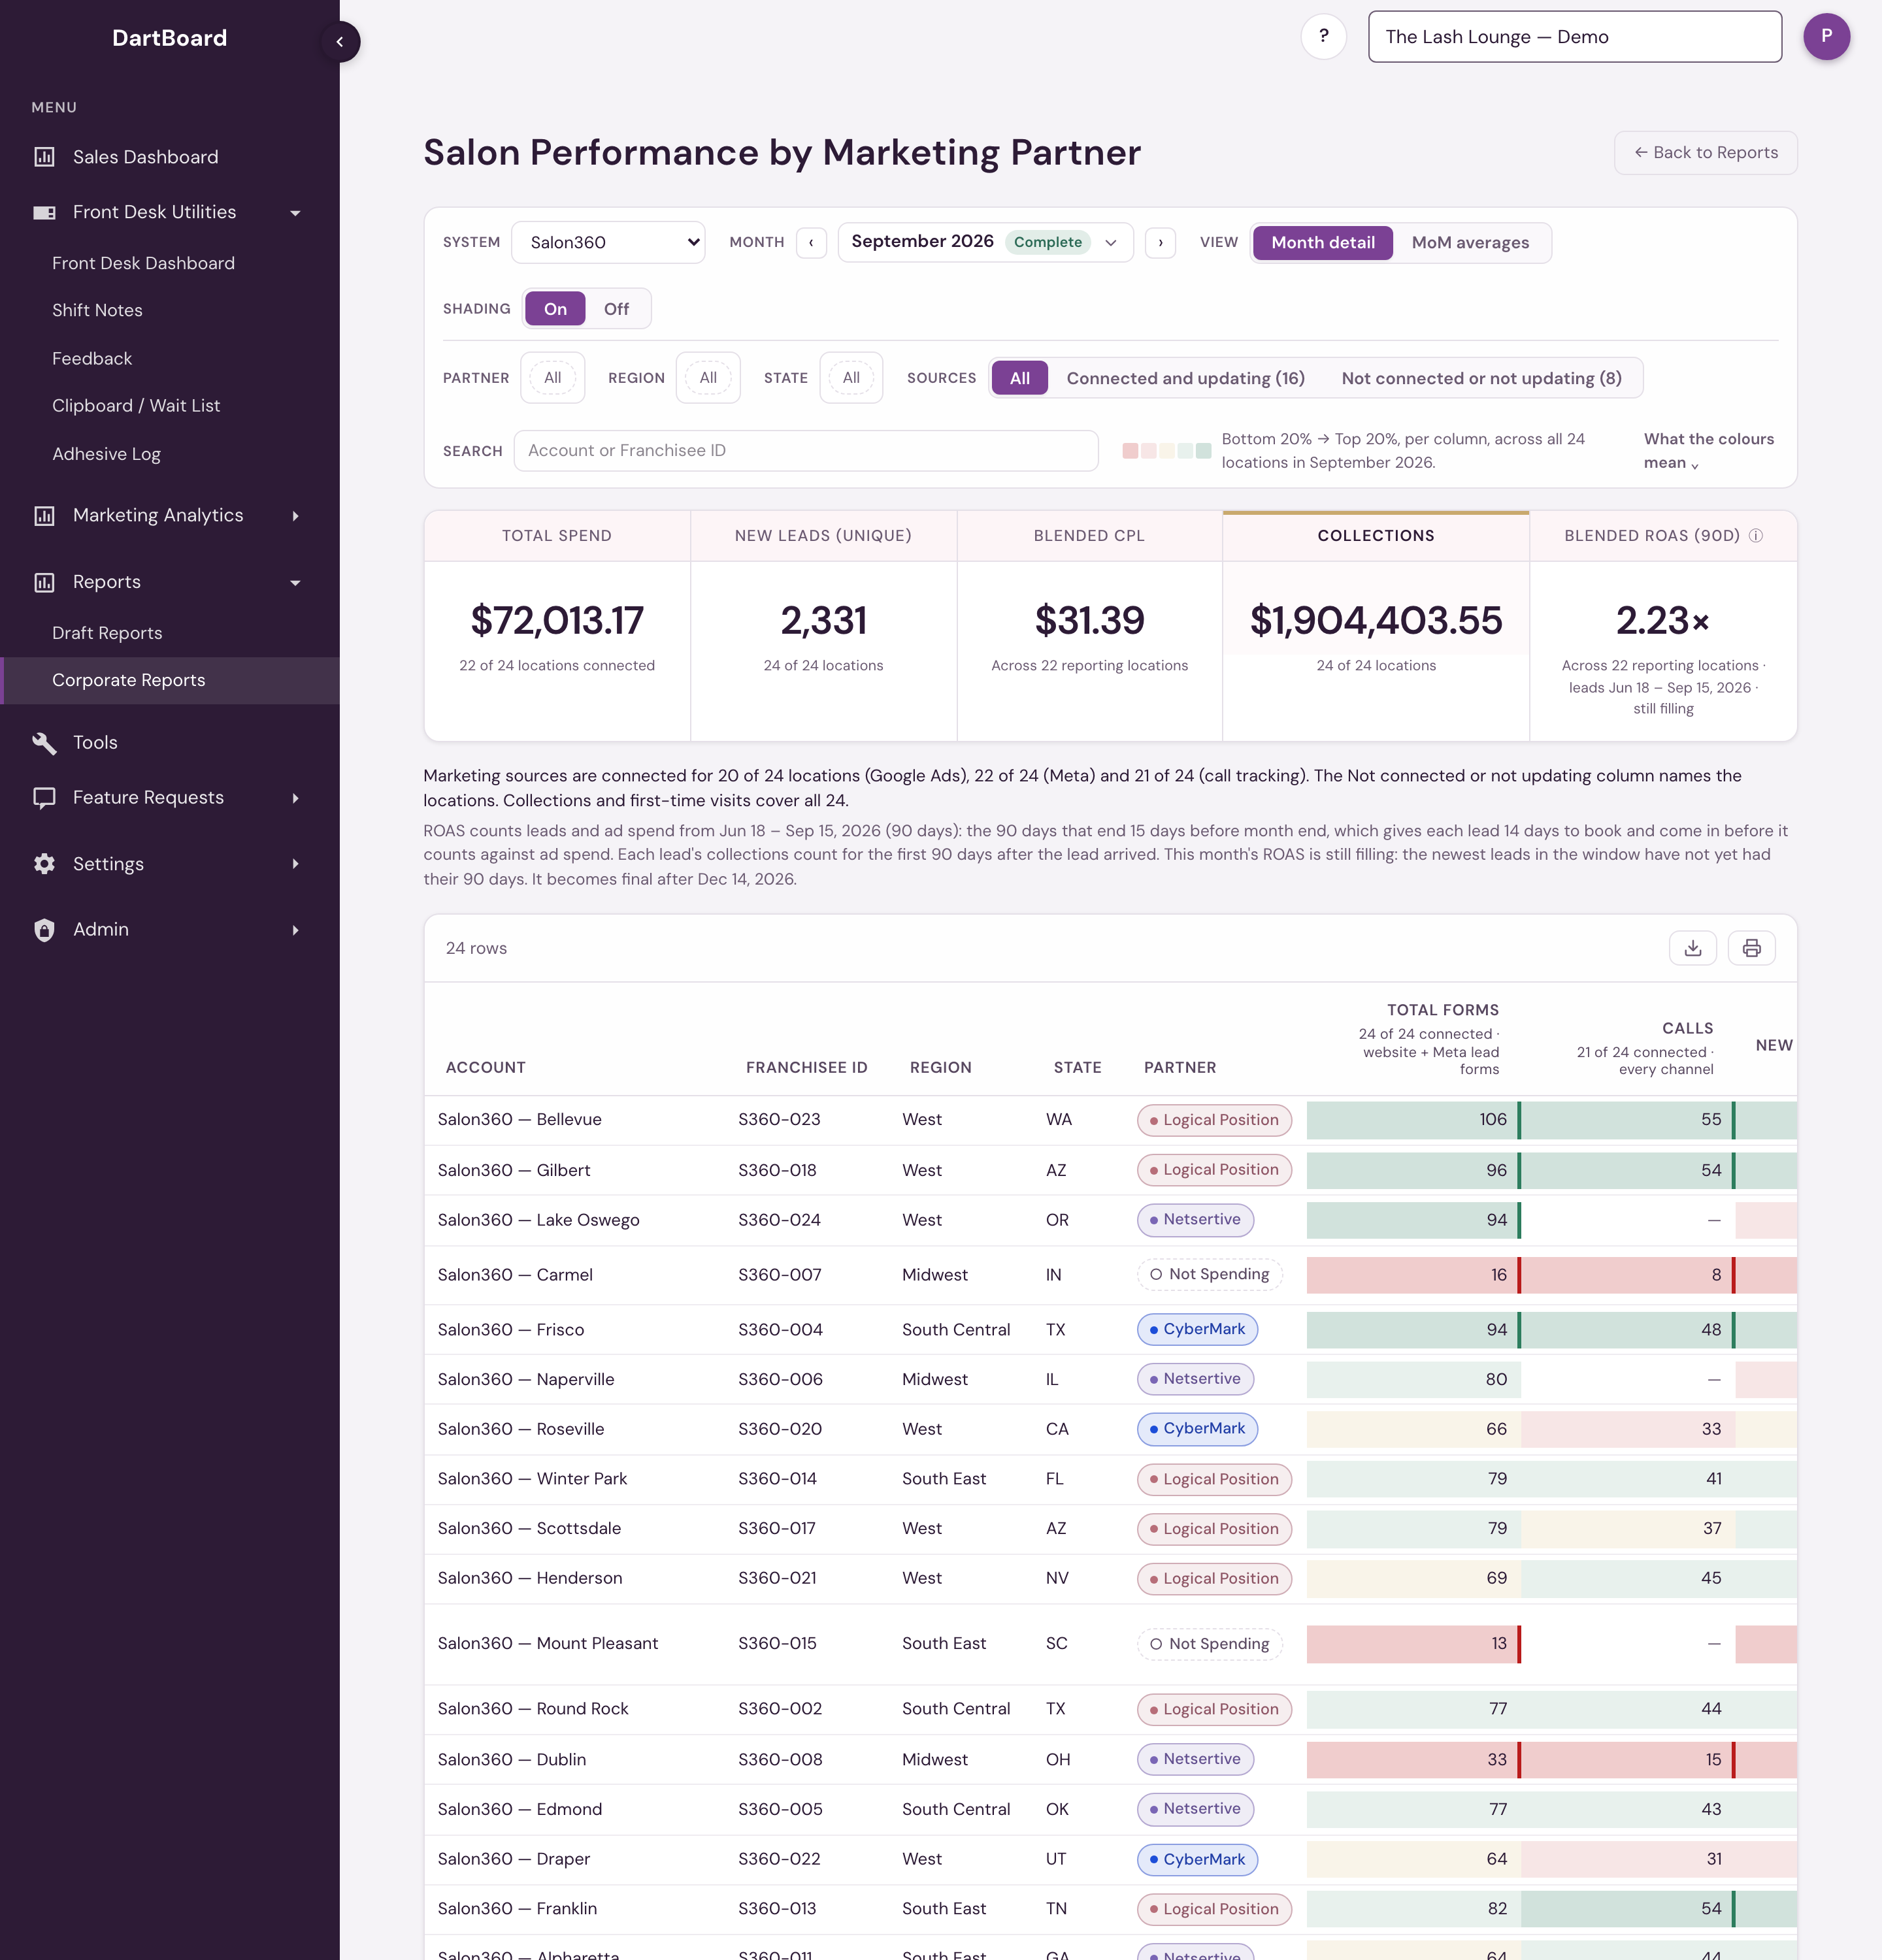
Salon Performance by Marketing Partner puts every location's marketing month on one grid: what was spent on Meta and Google, how many leads came in by form and by call, what each lead cost, how many new clients and dollars followed, and what those leads returned on the spend — with each location's marketing partner and region beside it, so you can compare partners on the same footing.
Find it in Corporate Reports under Marketing.
The report shows one franchise system's locations. If your access covers more than one system, you choose the system before the report runs, and a System picker at the start of the toolbar lets you switch; both list only the systems you have access to.
Running it
If you have more than one franchise system, the report asks which one to show before it runs, and opens on the system you looked at last when you come back. Switch at any time with System. Changing it keeps the month and clears the Partner, Region, State and Sources filters and the search, since those belong to the system you were on. The Excel export covers the system on screen.
The report opens on the most recent complete month. Use the Month picker (or the arrows beside it) to move to another month; the current month can be selected and is marked Partial.
Two views share the same toolbar:
- Month detail — one row per location for the selected month. Filter by Partner, Region, State or Sources (all locations, Connected and updating, or Not connected or not updating: the locations the Not connected or not updating column names a source for), and search by account name or franchisee ID. Click a column heading to sort.
- MoM averages — one row per month, from the start of the year through the selected month, showing the per-location average of each column. Blended CPL and Blended ROAS (90d) on this view are fleet ratios — total spend divided by total leads, and the leads' total first-90-day collections divided by the ad spend in the same window — not averages of the location figures. Each month's Blended ROAS uses that month's own ROAS window, and a month whose figure can still move is marked still filling.
Shading colours each numeric column from the bottom 20% of locations (red) to the top 20% (green), per column, so a location's row reads as a quick profile. Switch it Off for plain numbers. On spend columns green means more invested, not more efficient — efficiency is Blended CPL, where green is low, and ROAS (90d), where green is high. A column is only shaded once at least 20 locations report a value for it.
The download button exports an Excel workbook: the MoM averages sheet first, then one tab per month with the same shading as the page, and a Notes sheet with the column definitions below.
Columns
| Column | What it means |
|---|---|
| Franchisee ID, Account, Region, State | From the location's corporate record. |
| Partner | The marketing partner assigned to the location at the end of that month, from the dated assignments your corporate team keeps under Settings → Corporate Settings → Franchise Management → Marketing Partners. Changing a partner today does not change earlier months. Not Spending marks a location with no partner that month. |
| Total Forms | New leads who came in by form in the month — website forms and Meta lead forms together. |
| Calls | New leads who came in by tracked call in the month, whichever source the call came from. |
| New Leads (Unique) | Total Forms plus Calls: the location's new leads for the month, the same figure as New Leads on Marketing Health for the same dates. Someone who paid at the location in the six months before reaching out is an existing customer, not a lead, and a repeat inquiry from the same person is counted once. Leads from today appear the next day. |
| FB Spend / Google Spend / Total Spend | Advertising spend for the month from the connected Meta and Google Ads accounts, and their sum. |
| Blended CPL | Total Spend divided by New Leads (Unique). Blank when nothing was spent, so a zero-spend location never reads as the cheapest. |
| FTV | First-time visits — clients whose first-ever kept visit at the salon fell in the month. A cancelled or no-show first appointment does not count; the client's first visit is the first one they actually attended. This is the same definition as New Clients on Monthly Salon Metrics. For Bishops shops and Frenchies studios it is each guest's first completed visit at that location; for Bishops that is the same count as New Clients on Monthly Shop Metrics. A guest who has visited one Frenchies studio and then visits another counts as a first-time visit at each, so a studio's figure can read a little above # of New Guests on the Zenoti KPI report, which counts a guest once across all studios. |
| Attributed Visits | Tracked leads (forms and calls) whose first visit after the lead landed in the month — the same conversion the Marketing Analytics pages count. It is the lead-driven part of the salon's intake; FTV is the whole of it, referrals and walk-ins included. |
| Collections | The location's collections for the month: money actually taken in, with tips and card convenience fees left out. The same figure as Roll Up Sales with Include CC Fees off. It is the whole location's sales, not only sales from the leads on this row. |
| ROAS (90d) | Return on ad spend, as a multiple (2.30× means every ad dollar brought in $2.30). The one column that is not the calendar month: it covers the ROAS window, 90 days that end two weeks before the end of the month. What the new leads from that window paid at the location in the first 90 days after the lead arrived, divided by the ad spend on the same days. It is the Blended ROAS (First 90d) figure on Marketing Health with the date range set to the window. The numerator is the leads' own collections, not the Collections column, and the denominator is the window's spend, not Total Spend. Blank when nothing was spent in the window, so a zero-spend location never reads as the best return. |
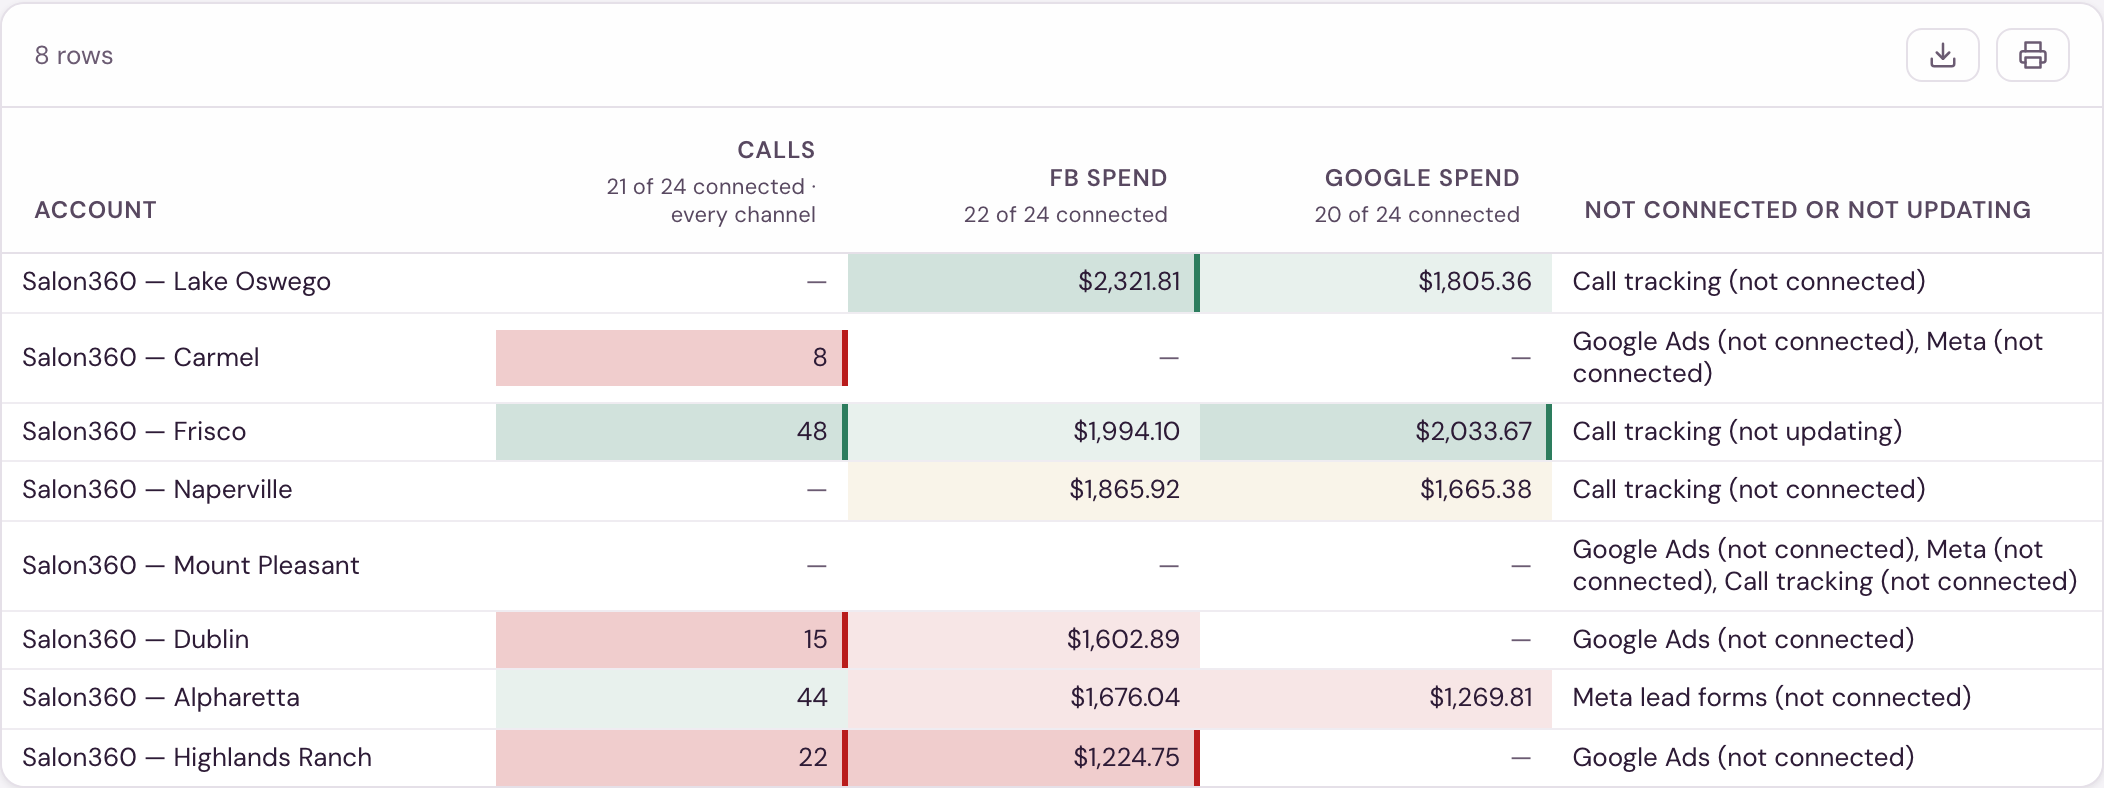
| Not connected or not updating | The marketing sources that are missing for the location in the month, each marked (not connected) or (not updating): Google Ads, Meta, Meta lead forms or Call tracking, for example "Meta (not connected), Call tracking (not updating)". A source that isn't connected leaves its cells blank. A source that isn't updating is named from the month it stopped; its cells keep what arrived before then, so they can read low. These are the same sources the notice on Marketing Health lists. Sort by the column to bring those locations together. Their spend, leads, Blended CPL and ROAS (90d) leave out what is missing, so read them with care (see Blank vs. zero). Here a dash means nothing is missing. A month with Meta or Google spend on record counts as connected for that source, even if the account has since been closed. |
| Notes | The note on the location's partner assignment in force that month. |
The ROAS window
A lead is not held to account for its ad spend on the day it arrives. ROAS gives each lead two weeks to book and come in, so the window stops two weeks short: the 90 days that end 15 days before the end of the month. Leads and ad spend both come from those 90 days.
Each lead's collections then count for a fixed 90 days after the lead arrived, the same for every month. A lifetime figure would always read highest for the oldest month, simply because its clients have had longer to come back; the fixed horizon is what makes one month comparable with another.
- For a finished month the window ends 15 days before the month's last day. September's ROAS, for example, covers leads and spend from June 18 to September 15.
- For the month in progress it ends 15 days before today, so the window slides day by day.
- On the MoM view, each month's Blended ROAS (90d) uses that month's own window.
Still filling. A month's figure is final once every lead in its window has had its 90 days, which is 90 days after the window closes. Until then the newest leads are still paying and the figure keeps rising, so the page marks the month still filling, on the Blended ROAS tile, beside the month's figure on the MoM view, and in the note under the table, with the date it becomes final. Until it settles the figure is a floor: it only rises. Compare months once they are final; the three most recent months are usually still filling.
The window and its status are written out under the table on the Month detail view and on the Notes sheet of the export. To see the same figure for one salon on Marketing Health, set its date range to the window's dates and Include collections through to First 90d.
Blank vs. zero
A dash means nothing is connected for that location — no Meta or Google Ads account, no call-tracking number, no lead form — so there is no number to show. A 0 means the source is connected and the value really was zero. A month with Meta or Google spend on record always shows that spend, even if the account has since been closed or put on hold by the ad platform.
When only one of a pair is connected — Google Ads but not Meta, or forms but not calls — Total Spend, New Leads (Unique), Blended CPL and ROAS (90d) are computed from the side that is connected. Treat those as a floor, not the full picture. A location that only started spending in the last two weeks has a Total Spend but a blank ROAS (90d), because nothing was spent inside the ROAS window yet.
Salons that share advertising
Some salons advertise together. The report shows them as one row, named for the salons it combines, with an information mark beside the name that explains why. Their ad spend, leads, sales and results are counted once in that row, and once in the region and marketing partner totals above the table. The Excel export uses the same row and name.
Available to corporate and admin users, like everything in Corporate Reports. You can run it for each franchise system your access covers, one system at a time, and for no other.