Weekly PE Summary
Weekly PE Summary is a corporate report that compares any date range up to one year long against the same calendar dates one year earlier, broken out by franchise system and by day. Ranges longer than a year are rejected so the current and prior-year windows can't overlap. It downloads as a multi-tab Excel workbook — it replaced a spreadsheet that used to be assembled by hand each week.
 123
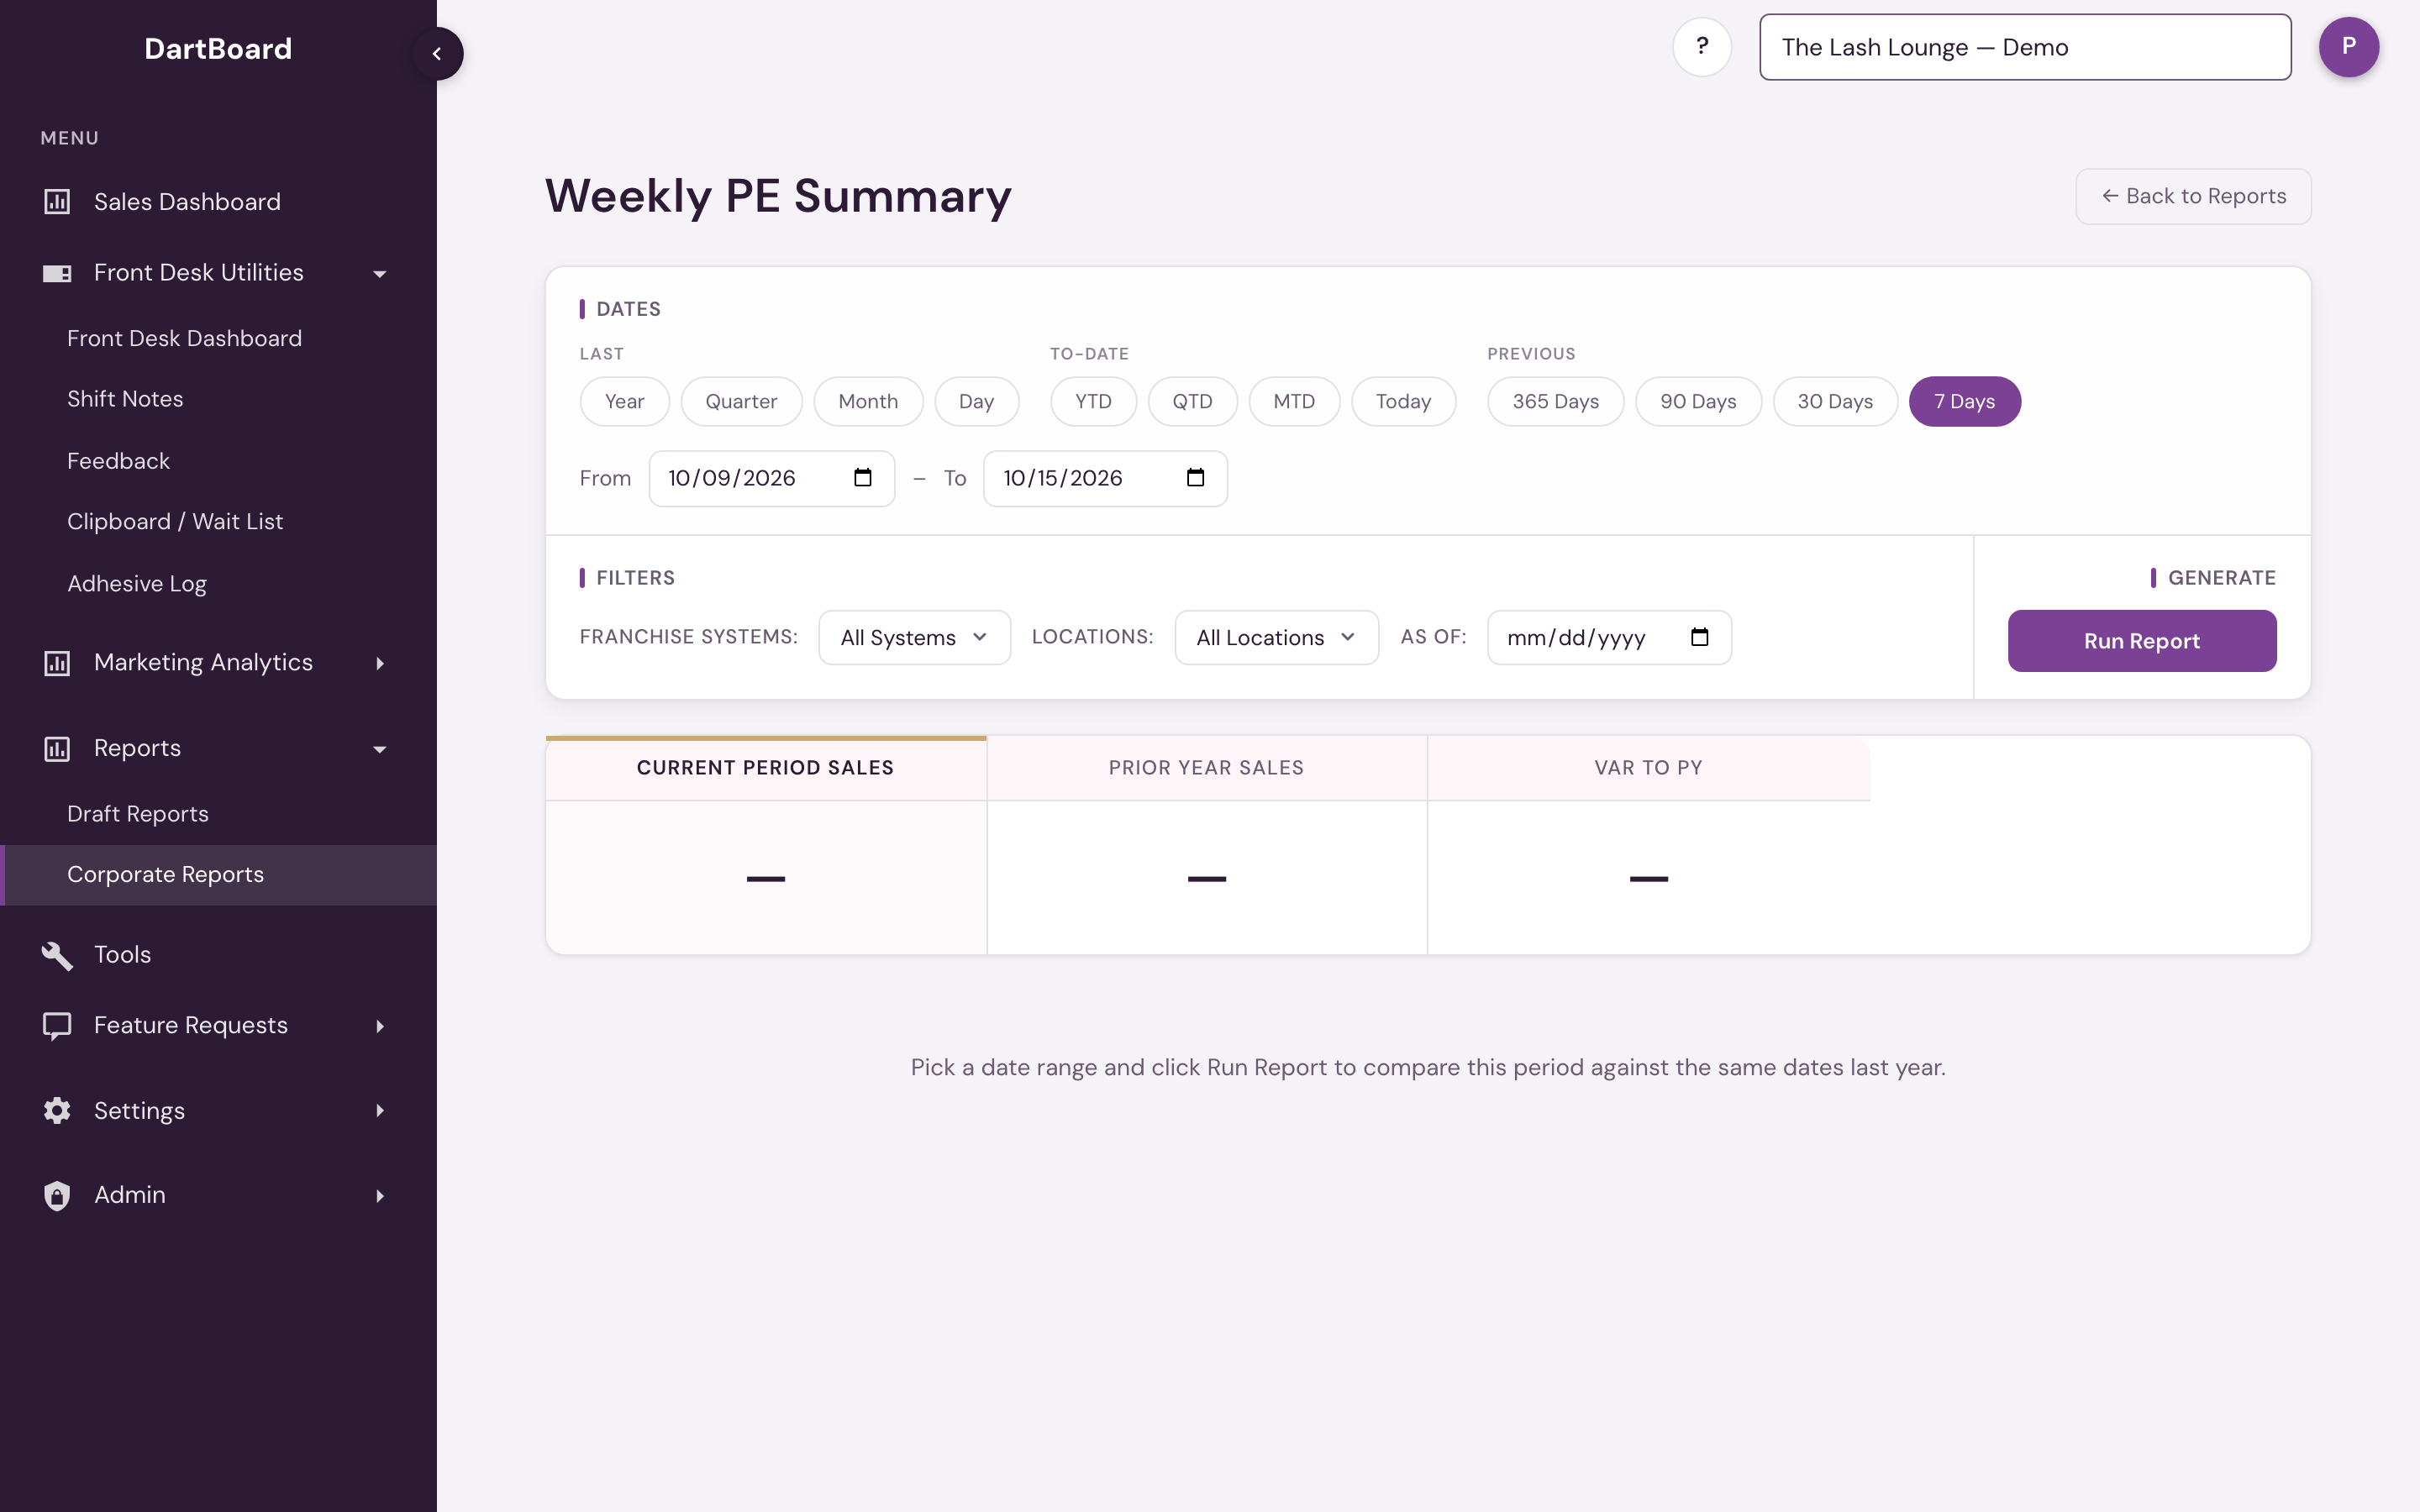
The screenshot shows the report before it's run — the KPI cards render with placeholder dashes until you pick a range and click Run Report.
Running the report
Pick a date range (defaults to the last seven days — this is a weekly report) and click Run Report. The Franchise Systems and Locations filters narrow which systems and salons are included. Both can only narrow within what your account already covers — they never widen your access.
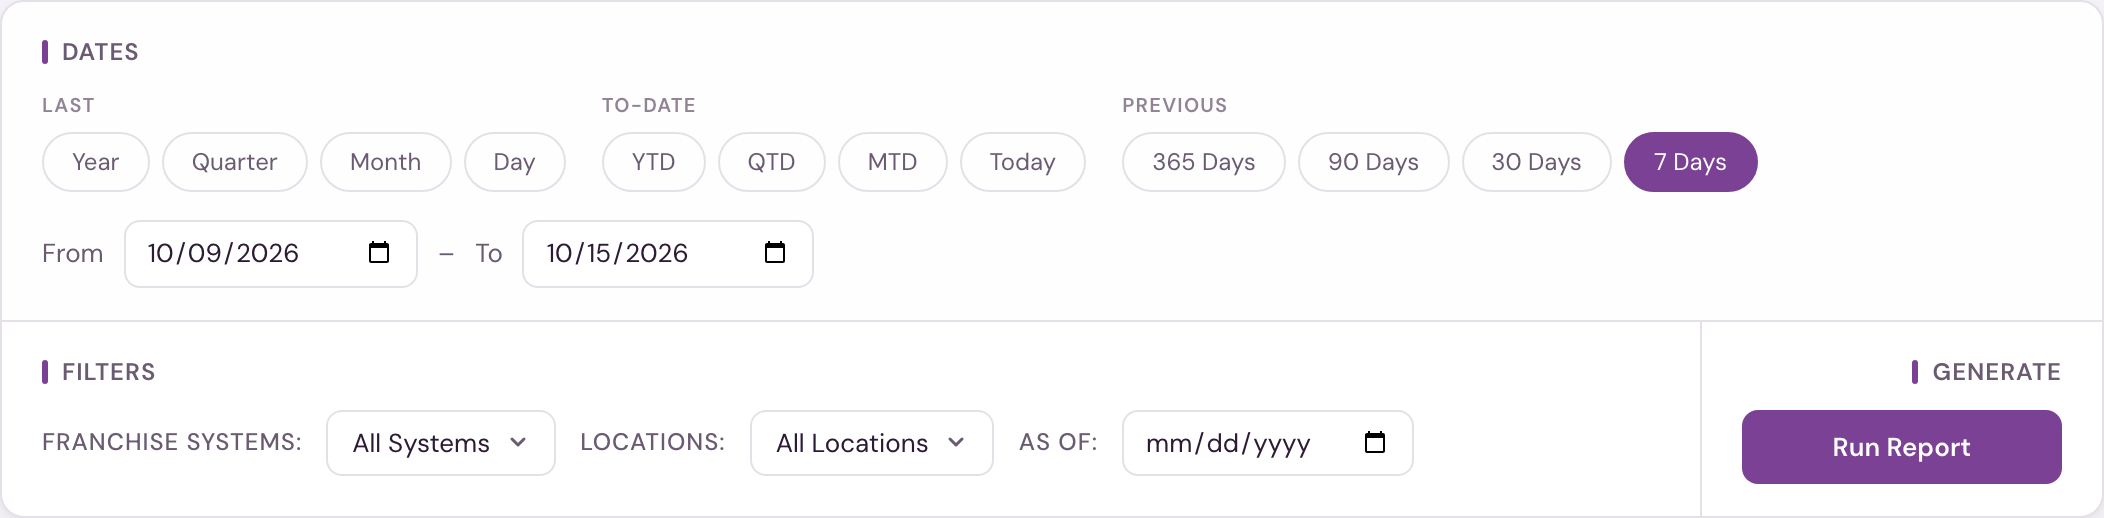
Once run, the toolbar shows "Compared to [date] – [date]" so it's always clear which prior-year window the report matched against.
How the sales are counted
Sales are real money taken, after tax, tips and card convenience fees are removed, with each salon counted under its own booking system. This report counts every sale through the end of the range you picked, today included; a sale dated after today is not counted. Franchise Performance counts completed days only, so for a range that ends today or yesterday its figure can be lower; for a range that has fully passed the two match.
A percentage cell is left blank when there is nothing to measure against — a prior-year or budget figure of zero — rather than printed as 0.0%.
As of: pin the report to a day
Beside the date range is an As of picker. It's optional — leave it blank and the report runs through the full range you picked, as normal.
Set it to pin the report to a single business date: Current Period Sales, Prior Year Sales and Pace all stop at that day, and the prior-year comparison is clipped to the same day offset into its own window, so the two sides stay like-for-like no matter which day you pin.
Two things worth knowing about what the pin does and doesn't do:
- It isn't a replay of what the report looked like that day. Sales get corrected — late postings, refunds and re-processed transactions all change history — so pinning to a past date shows today's knowledge of what happened through that day, not a snapshot frozen on that day.
- It isn't budget time travel. Each budget import replaces the numbers on file, with no history kept. Pinning "As of" to a day in March shows the current budget for March, not whatever budget was on file back then.
Within the Pace basis, the forecast pair — Pace to Month End and Month Budget — is the one exception to "everything stops at the pin"; see Prorated or Pace below for why.
When the pin runs ahead of the sales
You can pin a day that a system's sales haven't reached yet — the day before yesterday, say, when one booking system is still a day behind. The report doesn't pretend the pin is the data. Sales, prior year and Pace keep measuring through each system's own last day with actual sales, and a banner at the top of the report says so.
Two things change while that's true.
Budget follows the sales, not the pin. On Prorated, the Budget column (and its two variance columns) stops on the same day that system's sales stop, so a variance is never a short stretch of sales held up against a longer stretch of budget. The sub-caption under those columns names the day span it used, or says Through each system's last day with sales when the systems don't agree.
A second set of columns appears for the pinned date itself, each one captioned with the date range and the word (pinned):
- On Prorated, one column — Budget to As-Of Date, the budget through the day you pinned. There's deliberately no variance beside it: for the system that's behind, no sales exist that far yet to compare it against.
- On Pace, three — Pace to As-Of Date (that system's sales projected forward to the pinned day), Budget to As-Of Date, and Projected Var to As-Of Budget. That variance is a projection measured against budget, not a completed sum.
These extra columns appear whenever any system in the report is behind the pin — including on the rows of systems that aren't. A system whose sales already reach the pinned day shows the same figures in its measured columns and its (pinned) columns, because for that system both stop on the same day. That's expected, not a duplicate-looking bug: the (pinned) caption is what tells you which day each column is anchored to.
The three views
The report builds three views over the same results, switched with the tabs above the table:
- Summary — one row per franchise system: current period, prior year, the dollar and percentage variance to prior year, budget, the dollar and percentage variance to budget, and CC fees — plus an All Systems total row at the bottom.
- Per-system tabs — a day-by-day pivot per franchise system, one tab per system labelled by its short code (for example TLL for The Lash Lounge, FMN for Frenchies, BCC for Bishops Cuts / Color), ordered with the highest-selling system first. Each row is one day of the range — prior year beside current year, plus the dollar and percentage variance — and every day in the range gets a row even if neither year had sales.
- Detail — every location and every day across both periods, with each row tagged Current or Prior along with its Day #, weekday, Adjusted Sales, and CC fees. Very large detail sets are trimmed in the on-screen table for speed (a banner says so when it happens) — the downloaded workbook always contains every row.
Sales use the same Adjusted SalesMoney actually taken in, on the day it was paid. Tips are left out, and a gift card or membership credit counts when it is bought, not again when it is spent.Full definition → figure as the Roll Up Sales report as it opens, with Include CC Fees off: money actually taken in, with tips and card convenience fees left out and nothing added when a gift card or membership credit is spent. The CC Fees column shows the card convenience fees that were left out, for the current period.
Credit-card fees are currently tracked for The Lash Lounge only, so the CC Fees column is empty for Bishops and Frenchies.
The KPI row shows Current Period Sales, Prior Year Sales, and Var to PY as totals across every franchise system in scope. These three cards stay the same whichever tab you're on — only the table below changes.
Prior year lines up on the calendar, not the weekday
The prior-year column is the same calendar dates one year back: June 1st compares with June 1st, not with "the first Monday of June." Weekdays therefore drift between the two years — the 1st might be a Monday this year and a Sunday last year — so both sides are labelled with their weekday and the workbook carries the same labels.
Budgets
Budget and Var to Budget read from a daily budget set per franchise system. Budgets are entered per day, and the report sums exactly the days you're looking at — no rounding, no weekly buckets, no averaging a monthly figure down to a week. Pick nine days and you get nine days of budget, summed exactly.
Budgets arrive by workbook upload only — there's no way to type or hand-edit a figure directly on the report or in the grid. Corporate admins import a budget workbook through the guided flow under Franchise Management (Settings → Corporate Settings → Franchise Management → System Budget): pick the sheet, confirm which columns hold the figures, review a preview of new/changed/unchanged days, then apply. An import either applies in full or not at all, with every problem listed at once if any row is invalid.
Prorated or Pace
While the Summary tab is showing, a Budget toggle appears beside the tab switcher. It offers two ways to read the same budget. It's only on Summary — the per-system and Detail tabs carry prior-year columns, not budget ones.
Prorated is the default. It compares sales in the range you picked against the budget for exactly that range, summed day by day. If you've pinned an As of day, this basis stops at that day too, on both the sales and the budget side, so the comparison stays like-for-like. If the day you pinned is further along than the sales, budget follows the sales instead and an extra (pinned) column shows the pinned date on its own — see When the pin runs ahead of the sales.
Pace answers a different question — are we going to make the month? It takes each system's sales so far, projects the rest of the calendar month from that system's own day-of-week averages, and sets the result against the whole month's budget. Weekday matters to the projection: a Saturday and a Tuesday aren't interchangeable, so each remaining day is estimated from the days that share its weekday.
The Pace view shows two different kinds of number side by side, and they aren't interchangeable — facts on the left, forecast on the right:
- Budget to Date and Var to Budget are a measured comparison. Both sides stop on the same day for each system — that system's own last day with sales, or your pinned As of day if it's earlier — so this variance is a completed sum against a completed sum, not an estimate.
- Pace to Month End, Month Budget, and Projected Var to Budget (with its percent, Projected Var to Budget %) are a forecast. Pace to Month End projects the rest of the month from each system's own day-of-week averages, then measures that projection against the whole month's budget. Because one side of this pair is a projection, its variance is forecast error, not a measured fact — it won't necessarily match what the month lands on.
The naming keeps the two kinds of number apart on purpose: Var to Budget belongs to the measured, to-date pair; the forecast pair is labelled Projected Var to Budget so it's never mistaken for a completed sum.
Each system is projected from its own most recent day of sales — or from the pinned As of day, when one is set. If one system's data is running a day or two behind the others, its missing days are still projected rather than quietly counted as zero. That same per-system day is also where Budget to Date stops for that system, so its fact pair stays like-for-like with its own numbers even while other systems are further along.
The forecast pair always measures against the whole month, even with a day pinned. Pace to Month End is a projection that runs to the last day of the month, so its target has to be the whole month's budget too — pinning As of narrows where the sales-so-far stop, but it never narrows Month Budget itself. The to-date pair works the other way: pinning As of is exactly what moves where Budget to Date stops. Because Pace reports on the full calendar month rather than the dates in the picker, it's only offered when your range starts on the 1st. Pick 1 June through today and it's available; pick an arbitrary week and it's greyed out with the reason on hover. The report's default range is the last seven days, so you'll need to change the dates to use it.
When budget cells go blank
If a franchise system's budget doesn't cover every day of the dates you selected, its Budget cells stay blank — not zero, and not a partial figure. On Prorated, a banner names which franchise systems are missing coverage for the range you picked. A blank always means "not fully budgeted," never "zero." This is the same rule Franchise Performance applies.
The All Systems total covers the systems that have a budget. When one system is blank, the All Systems Budget, Var to Budget and Var to Budget % are summed over the remaining systems and measured against those systems' own sales, so the total is one honest comparison rather than nothing at all. The banner says which systems are left out. The All Systems Current and Prior sales still include every system.
Month Budget (Pace) is withheld when a month isn't budgeted for every day of that month — for example, a workbook that only covers part of the month leaves the rest of it without a figure, so the whole-month target is incomplete and Month Budget (and its variance) is left blank rather than shown against a partial number. The All Systems figures for that basis cover the systems that do have a full-month budget. When this happens, a banner names the affected systems. If you see this, check that budget has been imported for every day in the month — a partial date-range import is the usual cause.
Coverage across locations doesn't gate Month Budget the way day coverage does: any day that has budget on file is counted toward the month, regardless of how many of the system's locations that budget covers. A workbook that only covers some of a system's locations, or a location set that changed partway through the month, is shown as-is rather than withheld — the day-level floor above is the only thing that blanks Month Budget.
Budget to Date and Var to Budget can go blank independently of Month Budget. They're checked against their own window — the days from the start of the month through today (or your pinned As of day) — so a system can be missing coverage there even when its full month is fine, or the other way around. The banner on the Pace view today is written for the Month Budget case; it doesn't separately call out a Budget to Date gap. If a system is missing coverage only for the to-date window, its Budget to Date and Var to Budget cells still go blank, but no banner currently explains why — treat a blank cell there the same way: it means the window isn't fully budgeted, not that it's zero.
The Excel download
The download is an .xlsx workbook, not a CSV: a Summary tab, a Summary (Pace) tab whenever Pace is available for the range, then a pivot and a detail tab per franchise system in scope. Both budget bases are always written, so the download doesn't depend on where you left the Budget toggle. Currency and percentages are formatted and totals are bolded. The workbook is prepared for you when you ask for it — the download link stays valid for your whole session.
Available to corporate and admin users on the Corporate Reports page.