Sales Dashboard
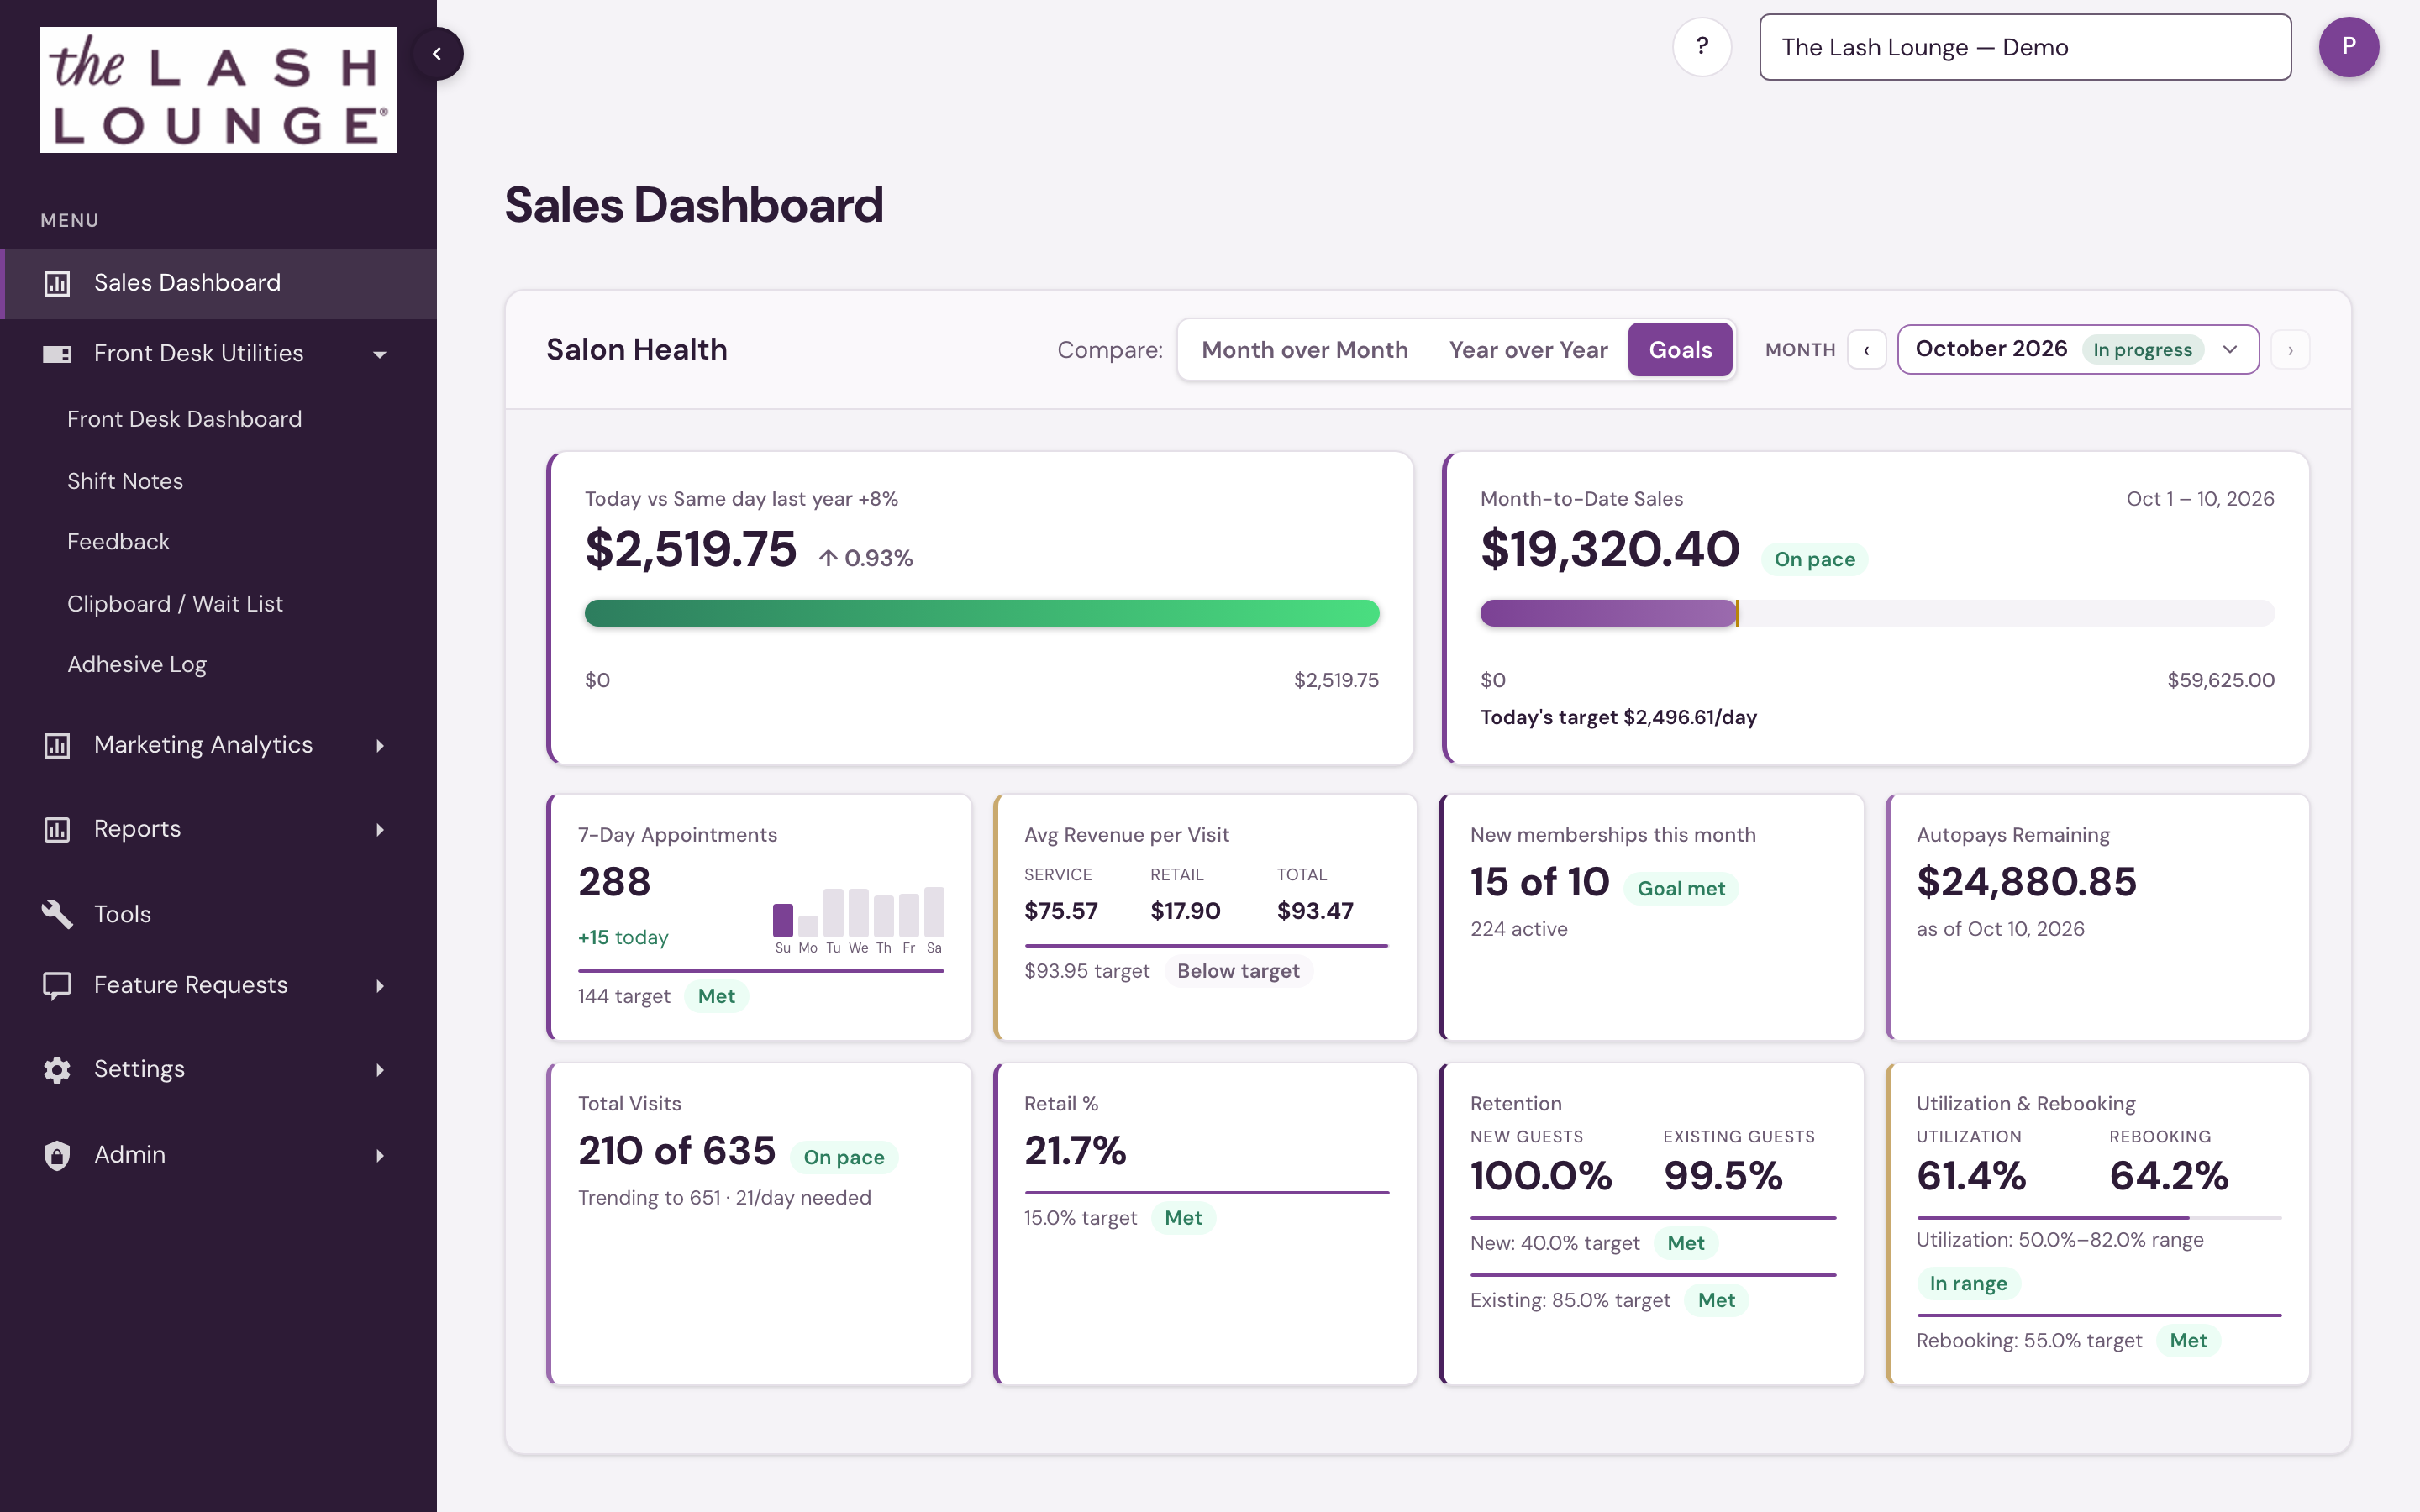
The Sales Dashboard is the home page of salon360 — a single view of how your salon is performing right now. It's organized into sections, each with its own date control, so you can look at today, month-to-date, or any custom range.
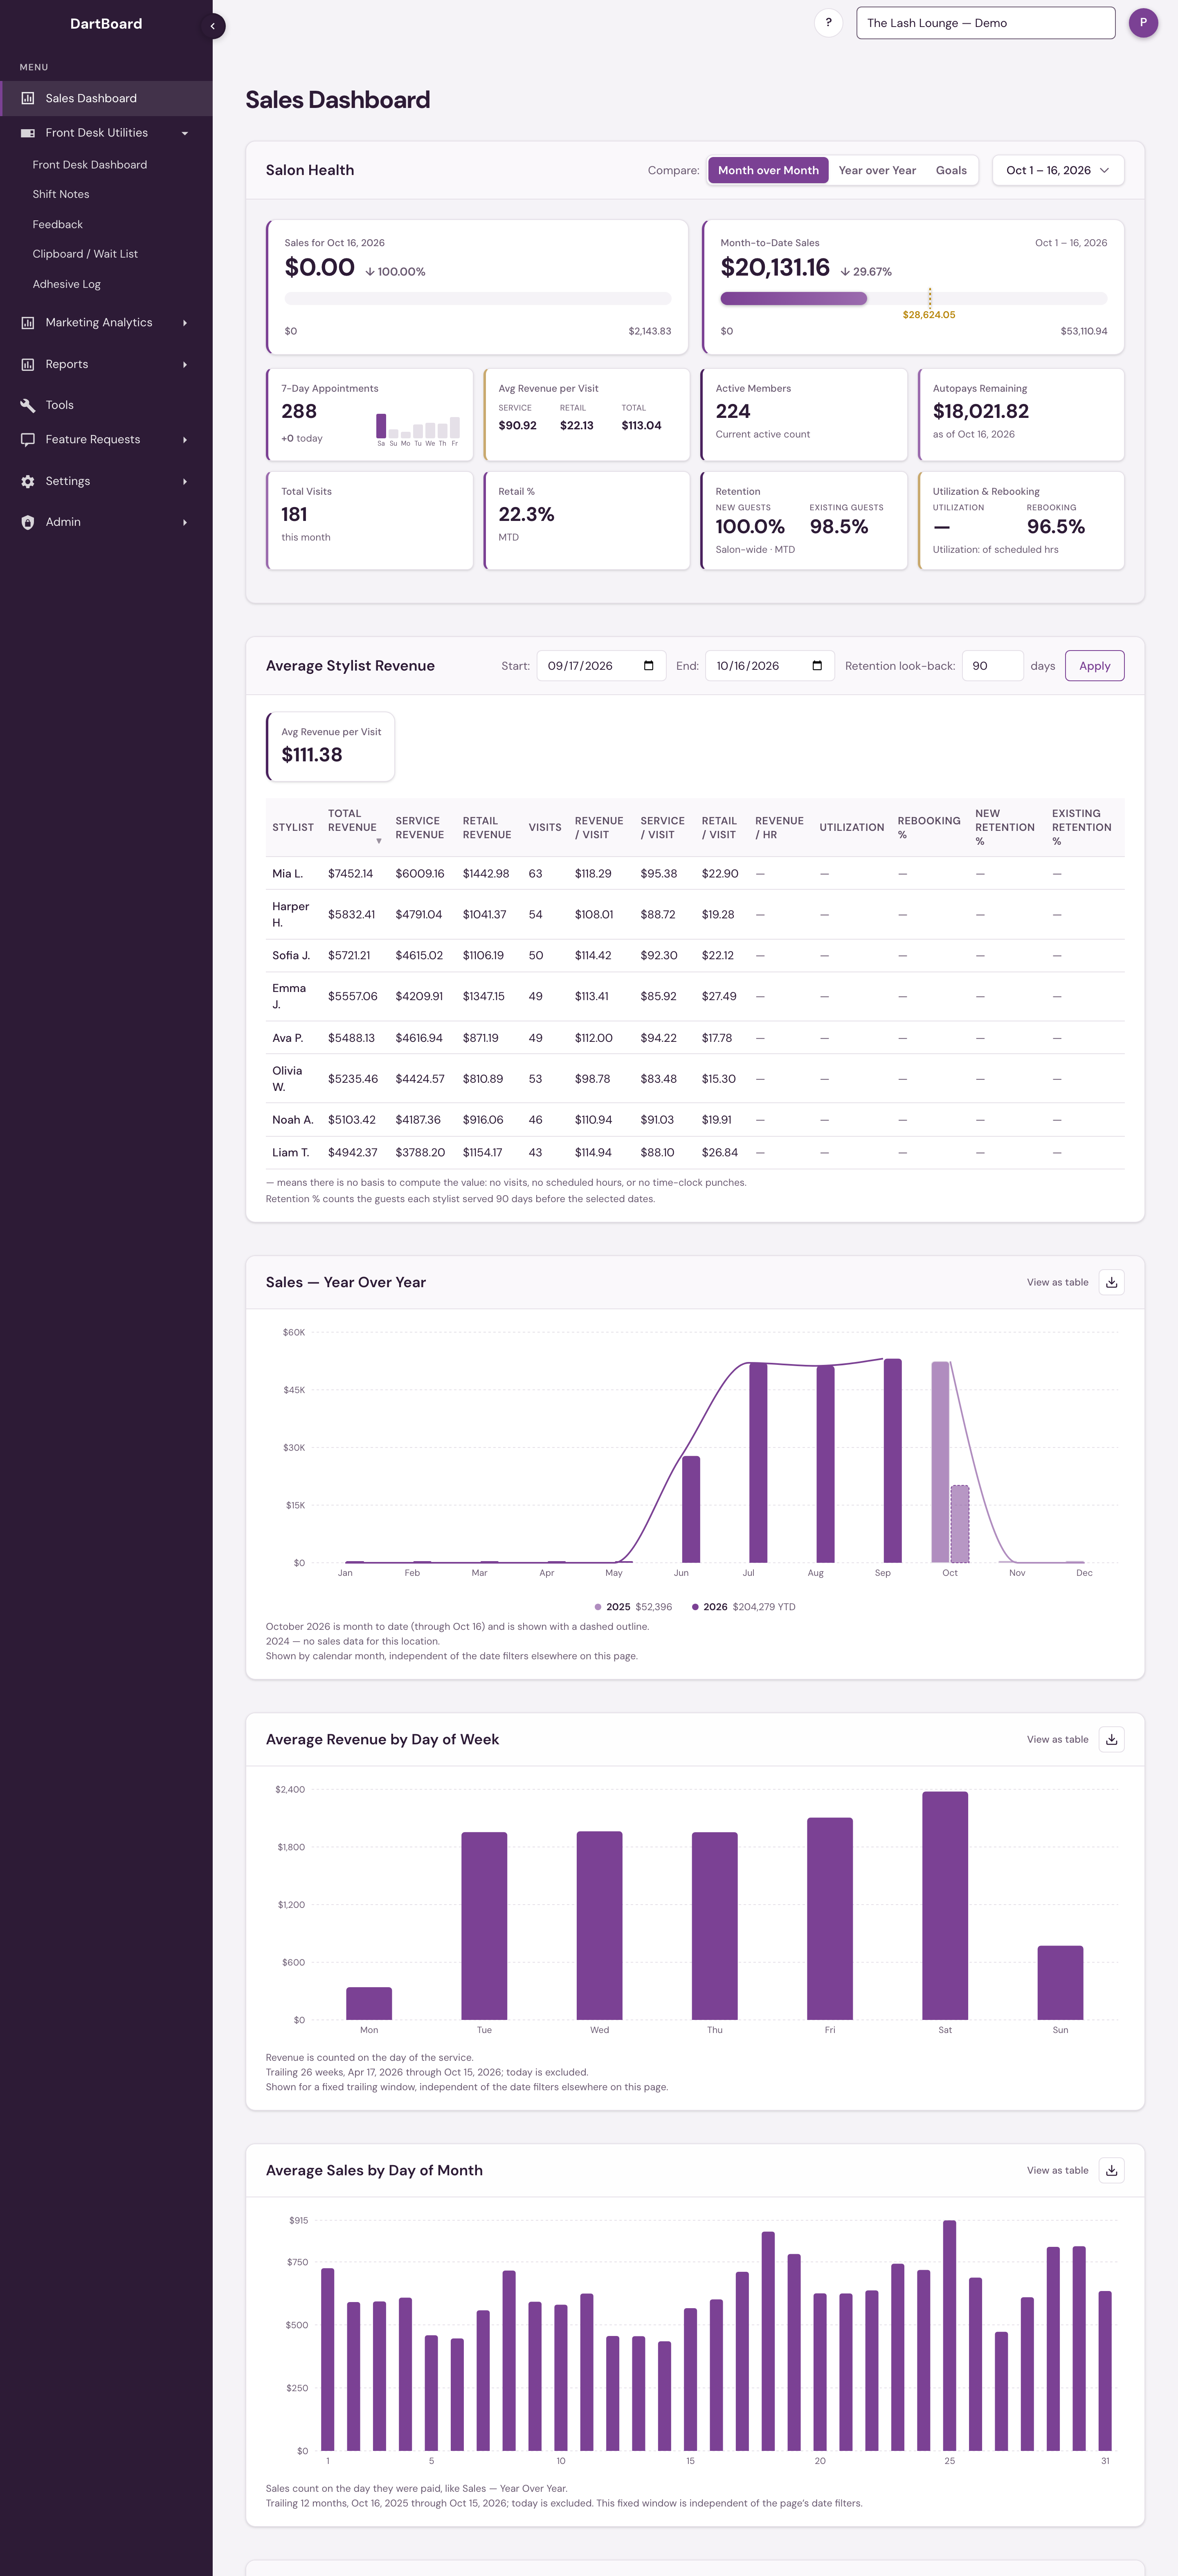 123456
The sections, numbered as in the screenshot above:
Two ways the dashboard counts sales
Before reading any number on this page, know that sales are counted in one of two ways. Every section below says which one it uses.
| Cash collected | Production | |
|---|---|---|
| Question it answers | How much money did the salon take in? | How much work did we deliver? |
| Counts on | The day the guest paid | The day the service was performed |
| Membership credit, gift cards, prepaids | Excluded when redeemed — the cash was counted the day it was sold | Included at full value — the work was done |
| Sales tax and tips | Left out | Left out |
| Used by | Salon Health sales bars, the Month-to-Date Sales card and your collections goal, Sales — Year Over Year, Average Sales by Day of Month | Avg Revenue per Visit, Retail %, Revenue / Stylist Hour, the Average Stylist Revenue table, Average Revenue by Day of Week |
Because a membership visit is worth $0 in cash but full price in production, the two will never add up to each other. That is expected, not an error.
Switching the sales figures to Revenue
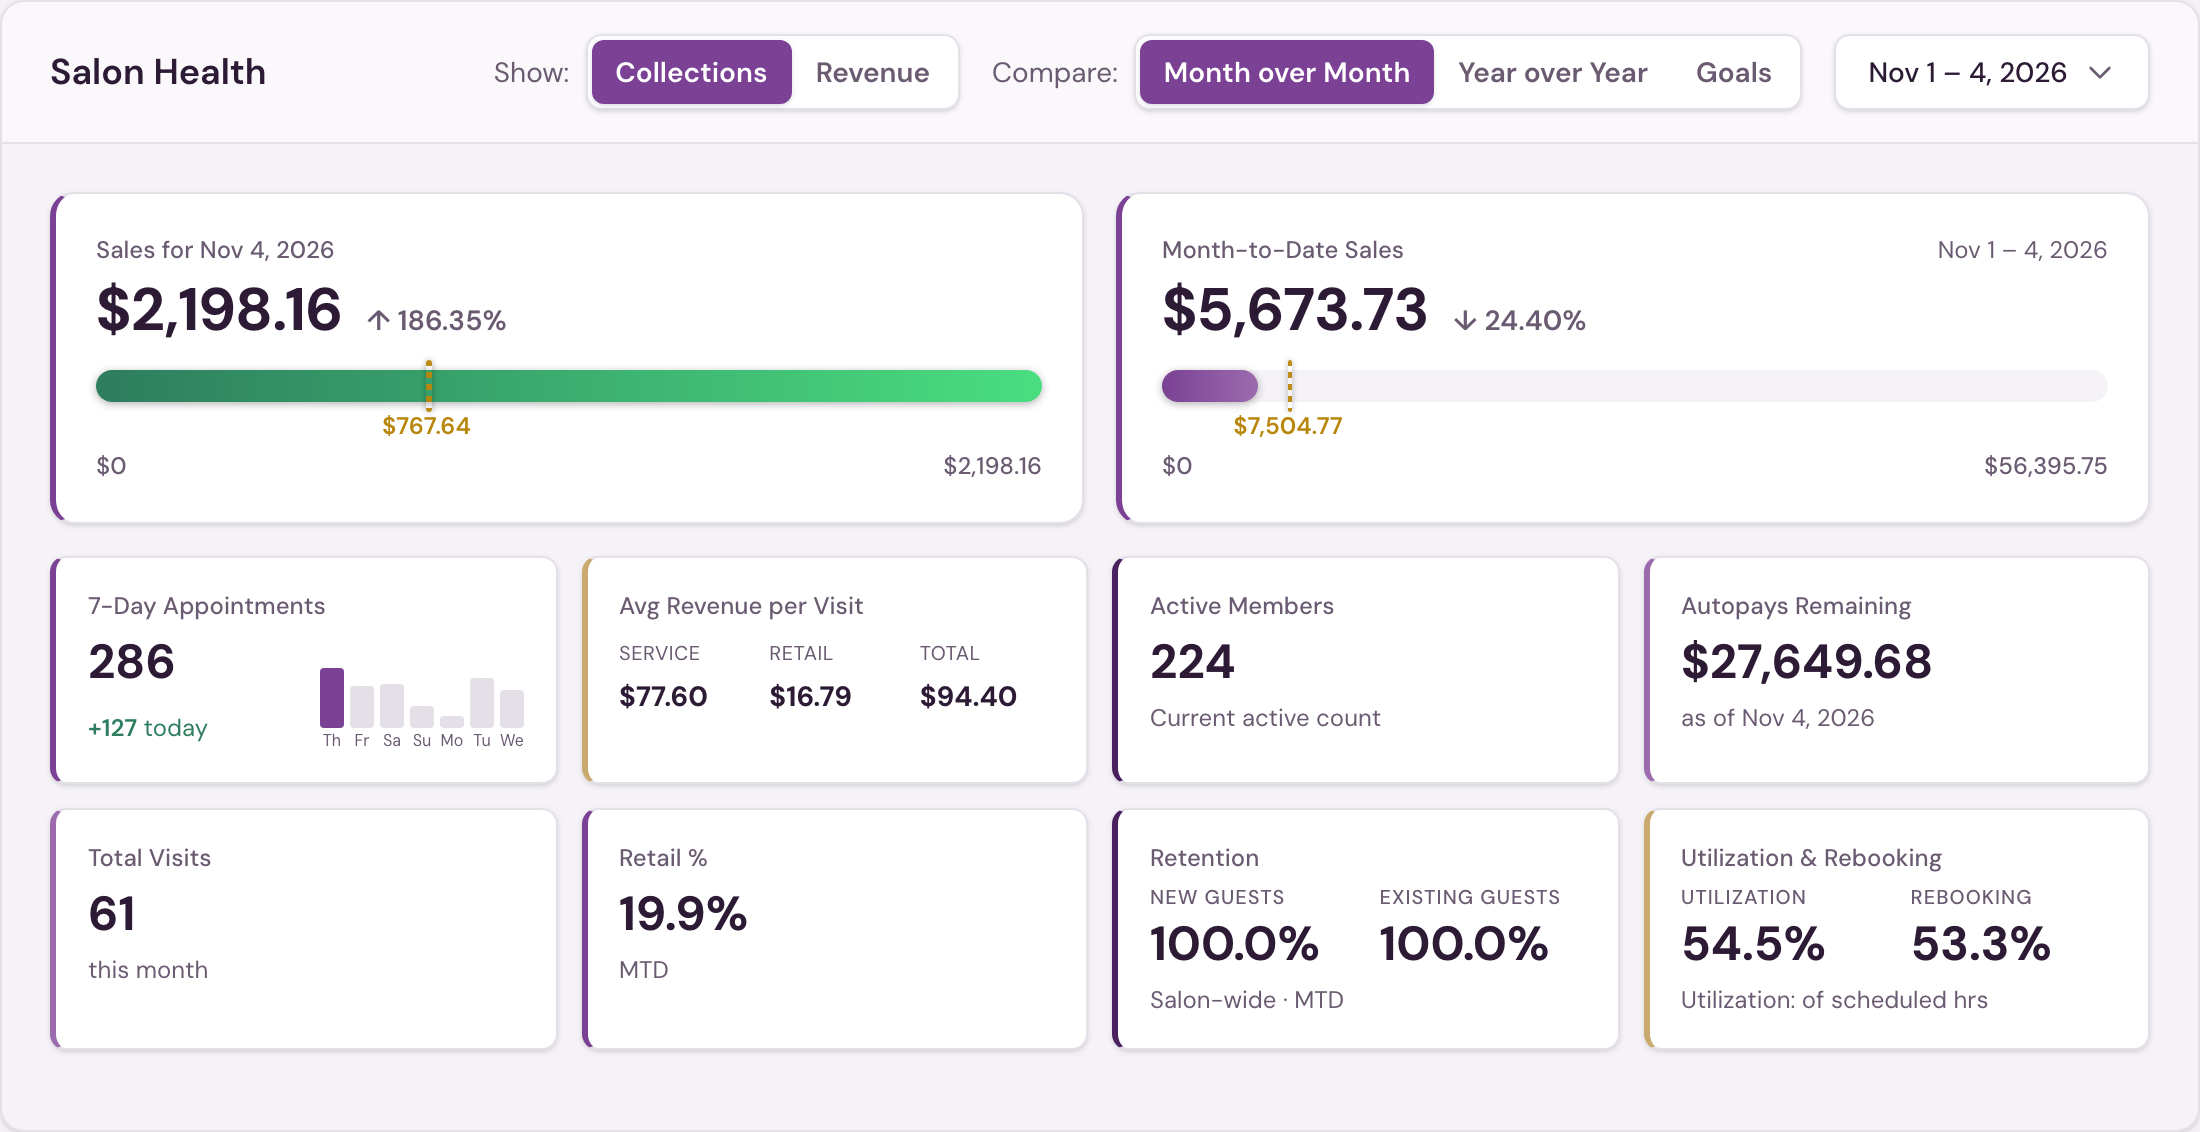
Every salon has a Show: Collections | Revenue switch in the Salon Health controls. Collections is the default: money taken in, on the day it was paid. Revenue counts each service on the day it was performed and each retail item on the day it was sold, however they were paid, plus no-show and cancellation fees. At Frenchies and Bishops it is the same figure as Total Revenue on the KPI report, so Revenue — Year Over Year for a month equals that month's KPI total. At The Lash Lounge it is the same figure as Total Revenue in Monthly Salon Metrics, and a member of another salon served at yours counts at the value of the credit they used.
The switch changes the sales bars and tiles in Salon Health, Sales — Year Over Year and Average Sales by Day of Month, and renames them Revenue while it is on. Average Revenue by Day of Week and the Average Stylist Revenue table are always what was sold, so they do not change. The month's goal is a collections goal, so with Compare set to Goals the section shows Collections and the switch is set aside; it returns when Compare goes back to Month over Month or Year over Year, on the basis you had chosen. The setting is carried in the page address, so a link you copy opens on the same basis. A salon can set its own starting basis in Salon Settings; otherwise the dashboard opens on Collections.
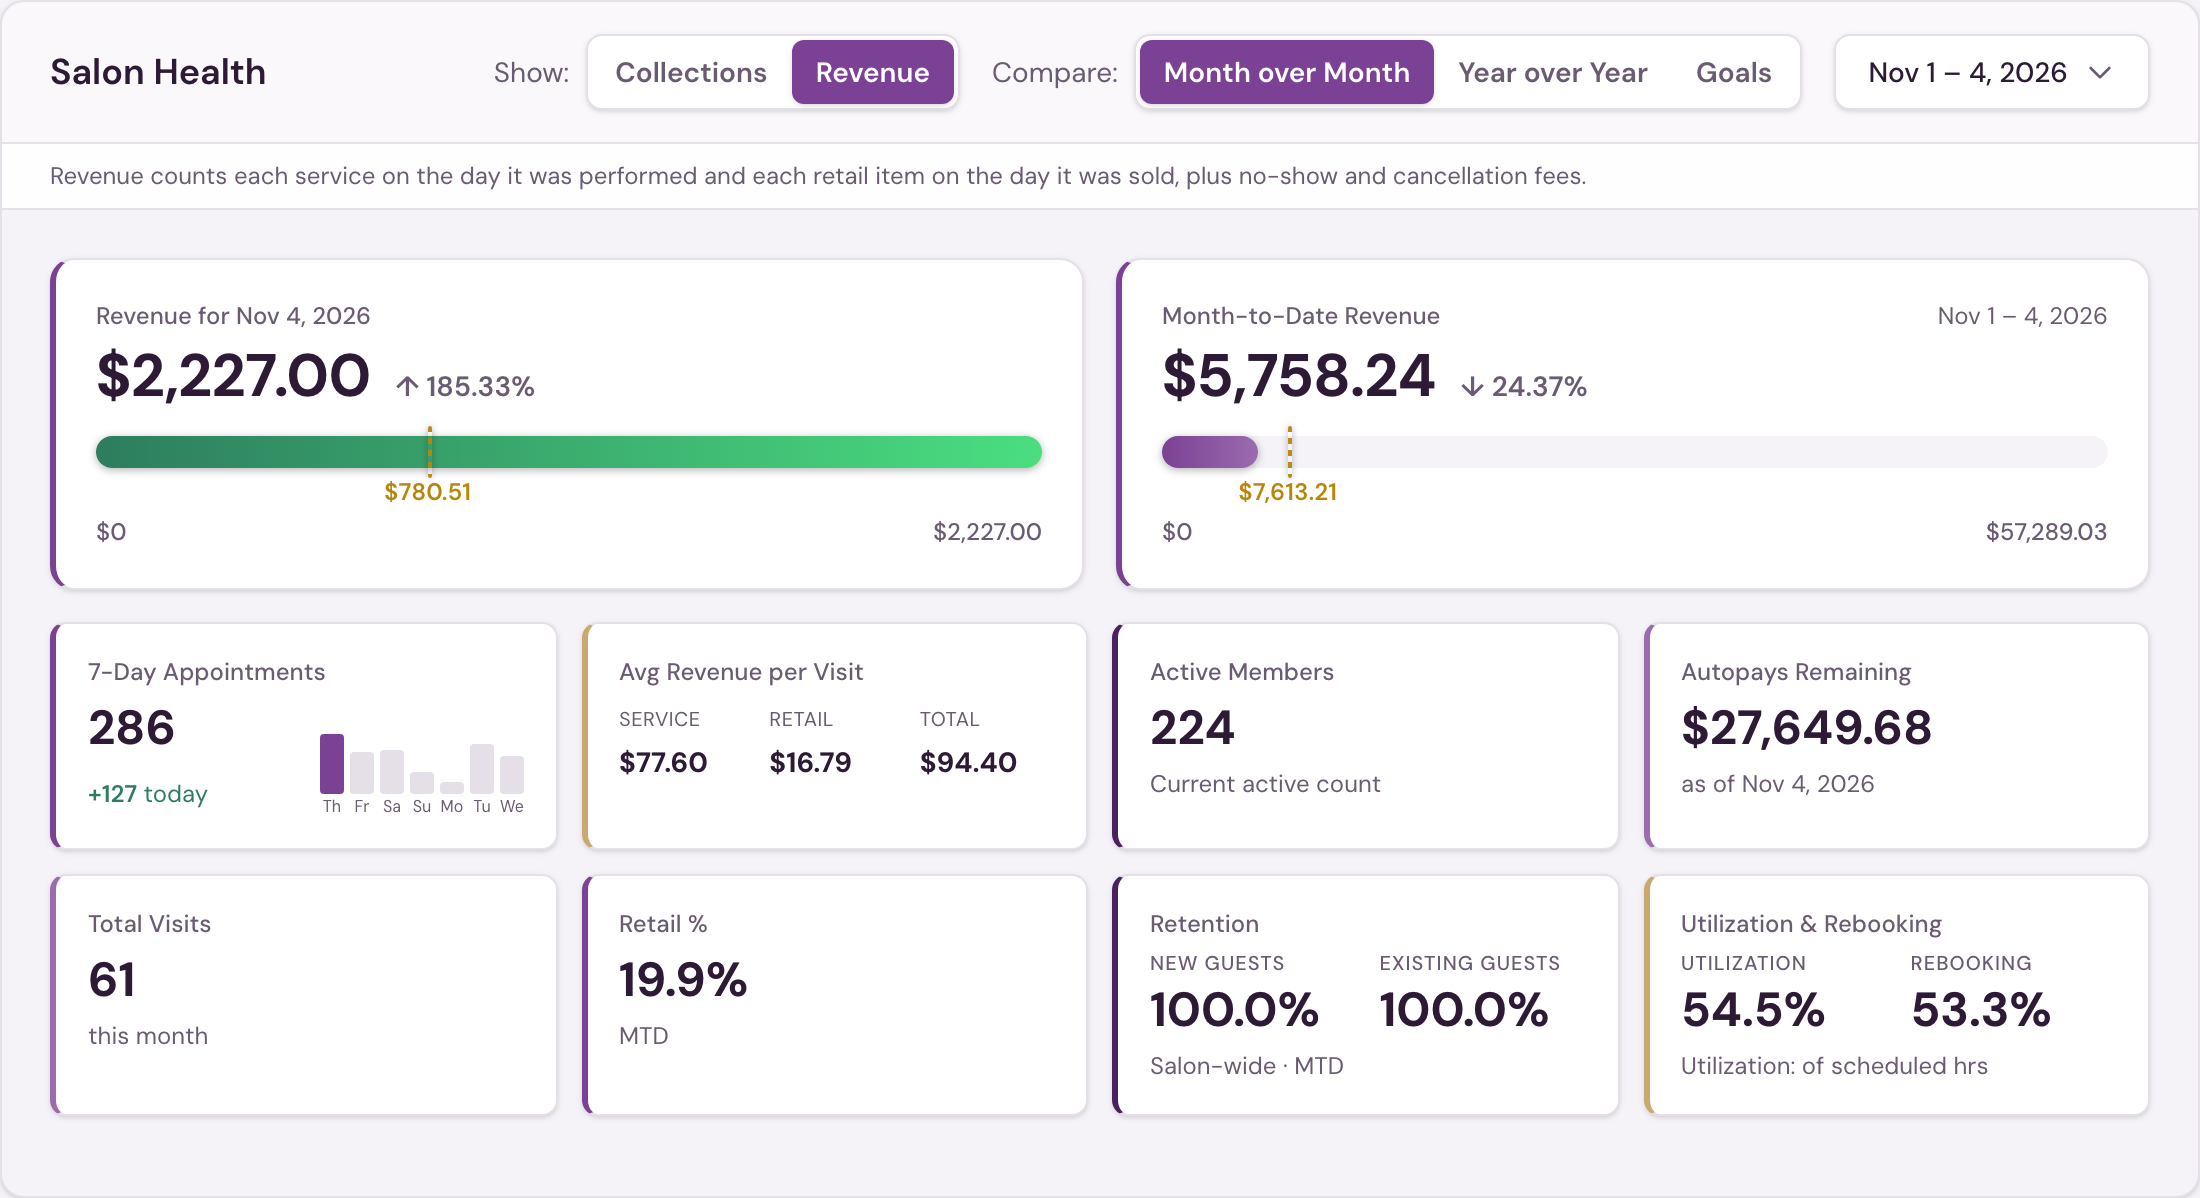
At The Lash Lounge, Revenue is built overnight. The caption under the controls says the date it is complete through; for a day after that date the day card shows a dash and says the data is delayed one day by MindBody's daily update; the figure appears once that update has run. The month-to-date figure covers the days that are complete, and its change against last month and last year compares the same number of days, so a day not yet in does not read as a drop. The full cash rules are in CollectionsMoney actually taken in, on the day it was paid. Tips are left out, and a gift card or membership credit counts when it is bought, not again when it is spent.Full definition →.
Salon Health
Salon Health is the sales snapshot at the top of the dashboard. Every dollar figure in the sales bars is cash collected (see above).
This section is called Shop Health at Bishops and Studio Health at Frenchies. It works the same way; the tile differences are noted below.
Sales bars. Two progress bars anchor the section:
- Latest-day sales — sales for the most recent day in your selected range, compared against the same day last month or last year.
- Period sales — total sales for the selected range (month-to-date by default), compared against the same period last month, the same period last year, or your monthly goal.
Hover for the math. Both bars reveal their full breakdown on hover:
- Latest-day bar — the day's sales, the same-day figure it's compared against (last month or last year), the percent change, and your average daily sales for the selected period.
- Period bar — the running total, the prior period through the same day (that's the dashed marker on the bar), the full prior month or year (the bar's endpoint), and the percent change against both. With a custom date range, the comparison is simply period vs. period.
- In Goals mode, the period bar's hover shows goal math instead: current month-to-date, the full goal, percent to goal, where you'd expect to be as of today, the day's target, and — if you're behind — the daily rate that catches you up. Flat goals pace evenly. Month-over-Month and Year-over-Year goals apply their growth percentage to the matching prior-period total through the same day.
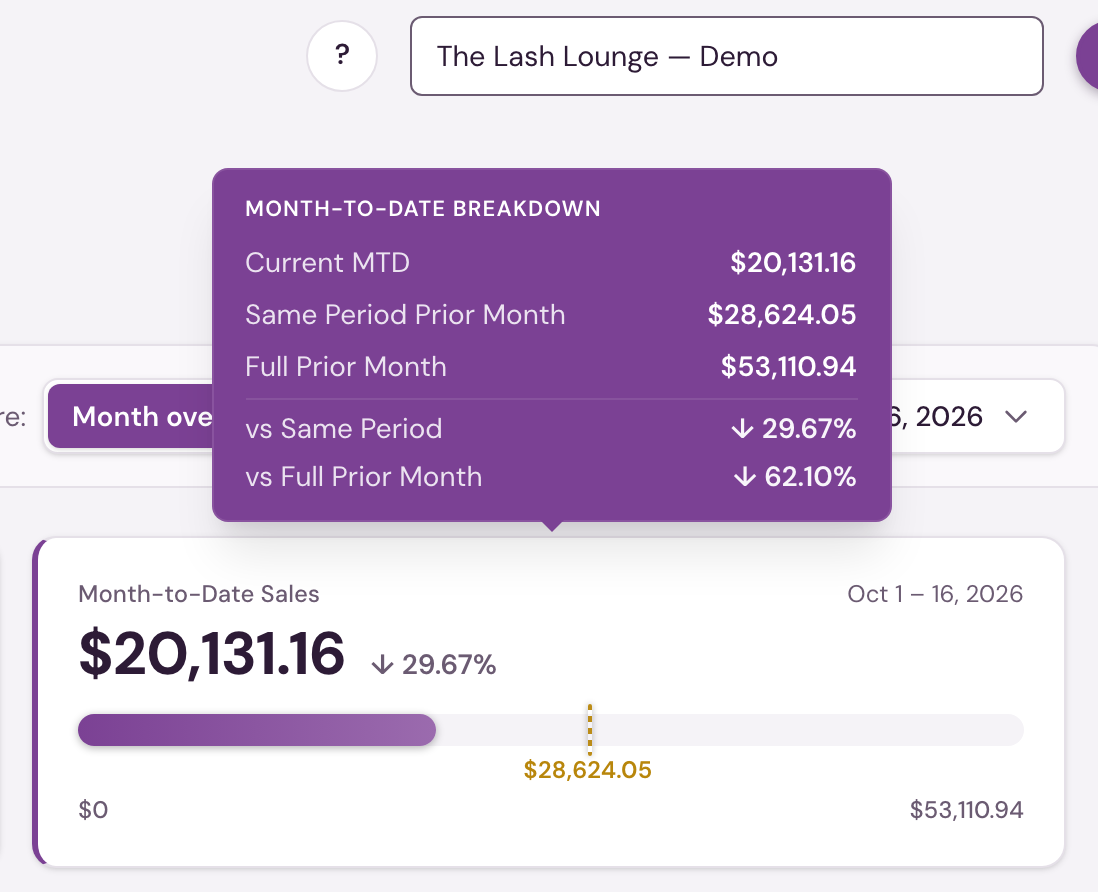
The Compare toggle switches the baseline between Prior Period / Month over Month, Year over Year, and Goals (see Goals mode below).
CC fees toggle. If your salon passes a credit-card convenience fee through to guests, an Include / Exclude toggle appears so you can view sales with or without those fees. It starts on Exclude, the same way sales are counted in Goals Report Card and the corporate reports, so a percentage collections goal works out to the same target in both places. It applies to the sales bars and tiles in this section and to the sales by month and by day of the month charts further down the page. The sales by weekday chart shows what was sold, which never includes the fee, so the toggle leaves it unchanged.
Tiles. Alongside the bars:
-
Avg Revenue per Visit — three figures: Service, Retail, and Total.
Avg Revenue per Visit = Revenue ÷ Attended visits
This tile is production, so a membership visit counts at full service value. It will not equal the cash sales bar divided by Total Visits. Visits here are guest-days: a guest counts once per day, so this is the same figure as Avg Revenue per Visit in Systemwide Data and Monthly Salon Metrics for the same dates.
Bishops shopsBishops shops also see a Revenue / Stylist Hour row at the bottom of this tile, with its own goal:
Revenue / Stylist Hour = services and retail sold ÷ hours clocked by its stylists
It's the value of the services and retail sold in the period, before tax, divided by your stylists' clocked hours. It uses what was sold rather than cash collected, so the hours are compared with the work done in those hours; it can differ slightly from the Month-to-Date Sales card for that reason. It is the same figure as Revenue / Stylist Hour in Systemwide Data and Monthly Shop Metrics. If nobody clocked in, the tile shows — rather than $0. A stylist who forgot to clock in makes the figure read high, because their sales count but their hours don't. With Compare set to Goals, it is graded against the Revenue per stylist hour goal.
Frenchies studiosFrenchies studios see Avg Ticket instead: the same idea, per ticket (one checkout) rather than per visit. It counts every ticket and all service and retail sales at the studio, and matches Avg Total Ticket in Zenoti's Business KPI report.
-
Retail % — how much retail the salon sells for every dollar of services it delivers.
Retail % = Retail sales ÷ Service sales
Both sides are production, counted the same way as Avg Revenue per Visit: services count at their value on the day they're performed, however they were paid (card, cash, membership credit, gift card or account), and retail counts on the day it's sold, whatever paid for it. Tax is left out of both; membership dues, gift card and package purchases, and tips are not sales here. Retail sold by the front desk counts. A figure of 5% means $5 of retail for every $100 of services. The same figure appears in the End-of-Day Summary, the Goals Report Card, Systemwide Data and Monthly Salon Metrics.
Frenchies studiosFrenchies studios see a Retail Sales card instead: retail dollars for the day and month-to-date, with month-over-month and year-over-year comparisons, and Retail % as a line underneath. Retail % is counted the same way and matches Retail % of Services in Zenoti's Business KPI report.
-
Active Members — the current count of active members when your date range ends today. When the range ends earlier in the current month, the tile keeps the live count. For a range that ends in an earlier month, The Lash Lounge salons see members with a successful autopay in that month (Members with an autopay in August) who were not on hold on its last day, the same figure as Active Members in Monthly Salon Metrics and Systemwide Data. A member who paid and then went on hold later that month counts as Suspended for that month, not Active. See Members & MembershipsA client with an active or suspended membership on file.Full definition → for exactly who counts.
Frenchies studiosFor a past date range, Frenchies studios see the members who were active at the end of that range, and the caption says so (Active at end of Aug 31). Any past date works.
-
Autopays Remaining — the dollar total of membership autopays still scheduled to draft between tomorrow and the end of the month. Only autopays belonging to a live membership count: scheduled charges left on the books after a membership is cancelled, frozen, or has autopay switched off are excluded because they won't collect. Autopays that already ran early are excluded too, so nothing is double-counted.
Bishops doesn't sell memberships, so shops don't see the Active Members or Autopays tiles, or the Membership Management section.
Your salon may also see additional tiles in this row — 7-Day Appointments (what's on the books for the next seven days; an add-on booked onto an appointment, such as a stylist upgrade, is part of that appointment rather than one of its own), Total VisitsA completed, attended appointment — booking alone doesn't count.Full definition → (attended visits for the period, counted per stylist per day — a guest seen by two stylists on one visit counts once for each), Utilization & Rebooking (UtilizationOf the hours stylists were scheduled to work, the share filled with booked appointments.Full definition → and Rebooking %Of the guests who came in that day, the share who left with their next appointment already on the books.Full definition → on one card), and Retention (salon-wide Retention %Of the guests the salon served, the share who came back or have a future appointment.Full definition →, shown separately for new guests on their first visit and existing guests who had visited before) — each covered under its own linked definition.
Every tile in this row follows the section's date range — pick Rolling 30, Rolling 60, or a custom range and Avg Revenue per Visit, Retail %, Total Visits, Rebooking % and Utilization all recompute for that window, with the caption under each tile naming the window it covers (MTD when the range is the current month to date). The one exception is 7-Day Appointments, which always looks at the next seven days from today; when your range doesn't include today, the tile says so. Retention % follows the range too, but measures an earlier group of guests so they've had time to come back: the guests seen 90 days before your range who have returned to any stylist or have a future booking (see salon-wide retention).
On the 1st of the month, a month-to-date range has no completed day in it yet, so these tiles show last month's final figures instead of dashes. The 1st is the salon's own date, so someone viewing from another time zone sees the same thing the salon does. Each affected tile is marked with the month (for example Sep final) beside its title, its caption names last month's dates, and in Goals mode it is graded against last month's goals. The two sales cards, 7-Day Appointments, Active Members and Autopays Remaining keep showing today. From the 2nd the tiles return to month-to-date, and a range you pick yourself (Rolling 30, Rolling 60 or custom dates) is always shown as picked. The one exception is a range that covers only the 1st itself, such as Today on the 1st: that is the same single day as month-to-date, so it shows last month's final figures too.
The Utilization tile shows two readings: Scheduled (appointment hours ÷ scheduled hours) and Clocked (appointment hours ÷ hours clocked in). See Against clocked hours.
Visits are counted as Tickets (Total Tickets): every ticket at the studio, matching Total # of Tickets in Zenoti's Business KPI report. Utilization uses Frenchies' own formula and counts every nail tech on the schedule, matching Utilization% in Zenoti's Business KPI report (see Utilization). Retention % follows Zenoti's Guest Retained rule: the guests seen in the calendar month four months back who came back within 90 days, shown separately for guests whose first visit was that month and for everyone else.
The 7-Day Appointments tile also shows how the count has moved since early this morning (for example, +6 means six more appointments are on the books now than were this morning). If this morning's starting count isn't available, the tile shows the live total and says Change unavailable rather than pretending the change is zero.
Goals mode
Switch Compare to Goals and Salon Health grades the month against the monthly targets set in Salon goals. Goals work a whole calendar month at a time, so the section's date control becomes a month picker while Goals is selected — arrows on either side step one month at a time, and clicking the month name opens a grid to jump further. It opens on the current month, and you can move it back to see how an earlier month finished — but not forward, since a month that hasn't happened yet has nothing to grade. To check the targets set for a month still ahead of you, use the month picker in Salon goals.
The view is built around pace, so a healthy salon doesn't look "behind" just because the month isn't over:
- Month-to-Date Sales gains a pace marker showing where you should be as of today, plus an On pace / Behind pace / Goal met pill. For a flat goal, the marker advances evenly through the month. For a percentage goal, it is the same prior-month or prior-year period through today, plus your chosen percentage.
- Under the bar, until the goal is met, a line ("$1,115/day needed for 15 days") shows what each remaining day must average to still hit the goal. It shows whether you're ahead or behind, in yellow when you're behind. The remaining days are the days after today: today's sales are already in the amount sold, so the figure is what each day from tomorrow on has to average, the same math as the end-of-day email. As today's sales come in, the amount still needed shrinks and so does the figure. On the last day of the month it reads "$420 to goal today".
- Hover the card for the numbers behind the pill: Sold so far, Goal, Expected by now (the pace marker's value), vs expected (how far ahead of or behind the marker you are, in dollars and percent), Remaining (what's left to the goal and how many days are left after today), and Needed per day (the same figure as the line under the bar). The pill and the vs expected line always agree — Behind pace means you're under Expected by now, not under the full-month goal.
- The latest-day bar uses the same comparison: Today vs Day Target for flat goals, or today against the exact prior-month/prior-year day plus the goal percentage. If that calendar day does not exist in the comparison month — March 31 against February, for example — the daily comparison is omitted rather than reusing February's last day. The cumulative pace marker remains available.
- Each KPI tile shows a small progress bar with target · so far and its own pill: Met, At target, or Below target. A tile whose data hasn't accumulated yet reads "awaiting data" rather than grading you against zero.
- At target covers landing within half a percent of the number — $94.97 against a $95.00 target is not a miss, and doesn't get flagged as one. The band is deliberately narrower than a single appointment on any realistic volume target, so a guest genuinely short still reads Below target.
- Total Visits grades against your monthly visits target and paces like the collections goal does — "228 of 426 · Behind pace · Trending to 354 · 40/day needed" — because completed-service visits accumulate through the month. Trending to projects your month-end total at the current run rate (it appears from the 5th of the month, once there's enough data to project from), and /day needed is the daily rate the remaining days require to still hit the goal — not your current rate. The remaining days are the days after today, the same rule as the collections goal; on the last day of the month it reads "12 to go today". Once the goal is met the caption switches to how far over you are ("12 over goal"); a closed month that missed shows the shortfall ("36 short of target"). Rate tiles (Retail %, Utilization, Rebooking %, Retention %) are a straight target-vs-actual check instead, since a percentage doesn't build up day by day.
- Utilization is graded against a range when you've set one in Salon goals ("50.0%–82.0% range"): In range is the win, Below target means stylists are under-used, and Over capacity (yellow) means you're above the max — the books are so full you're turning business away. The bar runs to the max rather than the min, so a full bar means no availability left.
A goal left blank in settings simply isn't graded, and if no goals are set at all, the section links you to the setup page.
Reviewing a month that has finished
Move the month picker back and the same tiles show how that month ended — including the New memberships tile at membership salons, which follows the goal month rather than today's month. Pace language drops away, because a finished month has no pace left to run — there's no day target or catch-up rate, and Behind pace becomes Below target, a single verdict for the month.
Three tiles behave differently for a past month, all for the same underlying reason — some numbers only exist in the present tense:
- 7-Day Appointments isn't graded. It counts what's on the books for the next seven days, so it only has a meaning today — there's no historical version of it to compare against.
- New Memberships isn't graded for a month that has already closed. salon360 only knows who is suspended as of each day it checks (the same limitation described under Systemwide Data), so a membership position for a past month can't be rebuilt the way collections or visits can.
- Utilization is measured against your current staff schedule, so a month reviewed months later is compared against the roster as it stands now, not as it stood then. Treat older utilization figures as a guide rather than an exact record.
To see several months at once instead of stepping back through them one at a time, see the Goals Report Card.
Average Stylist Revenue
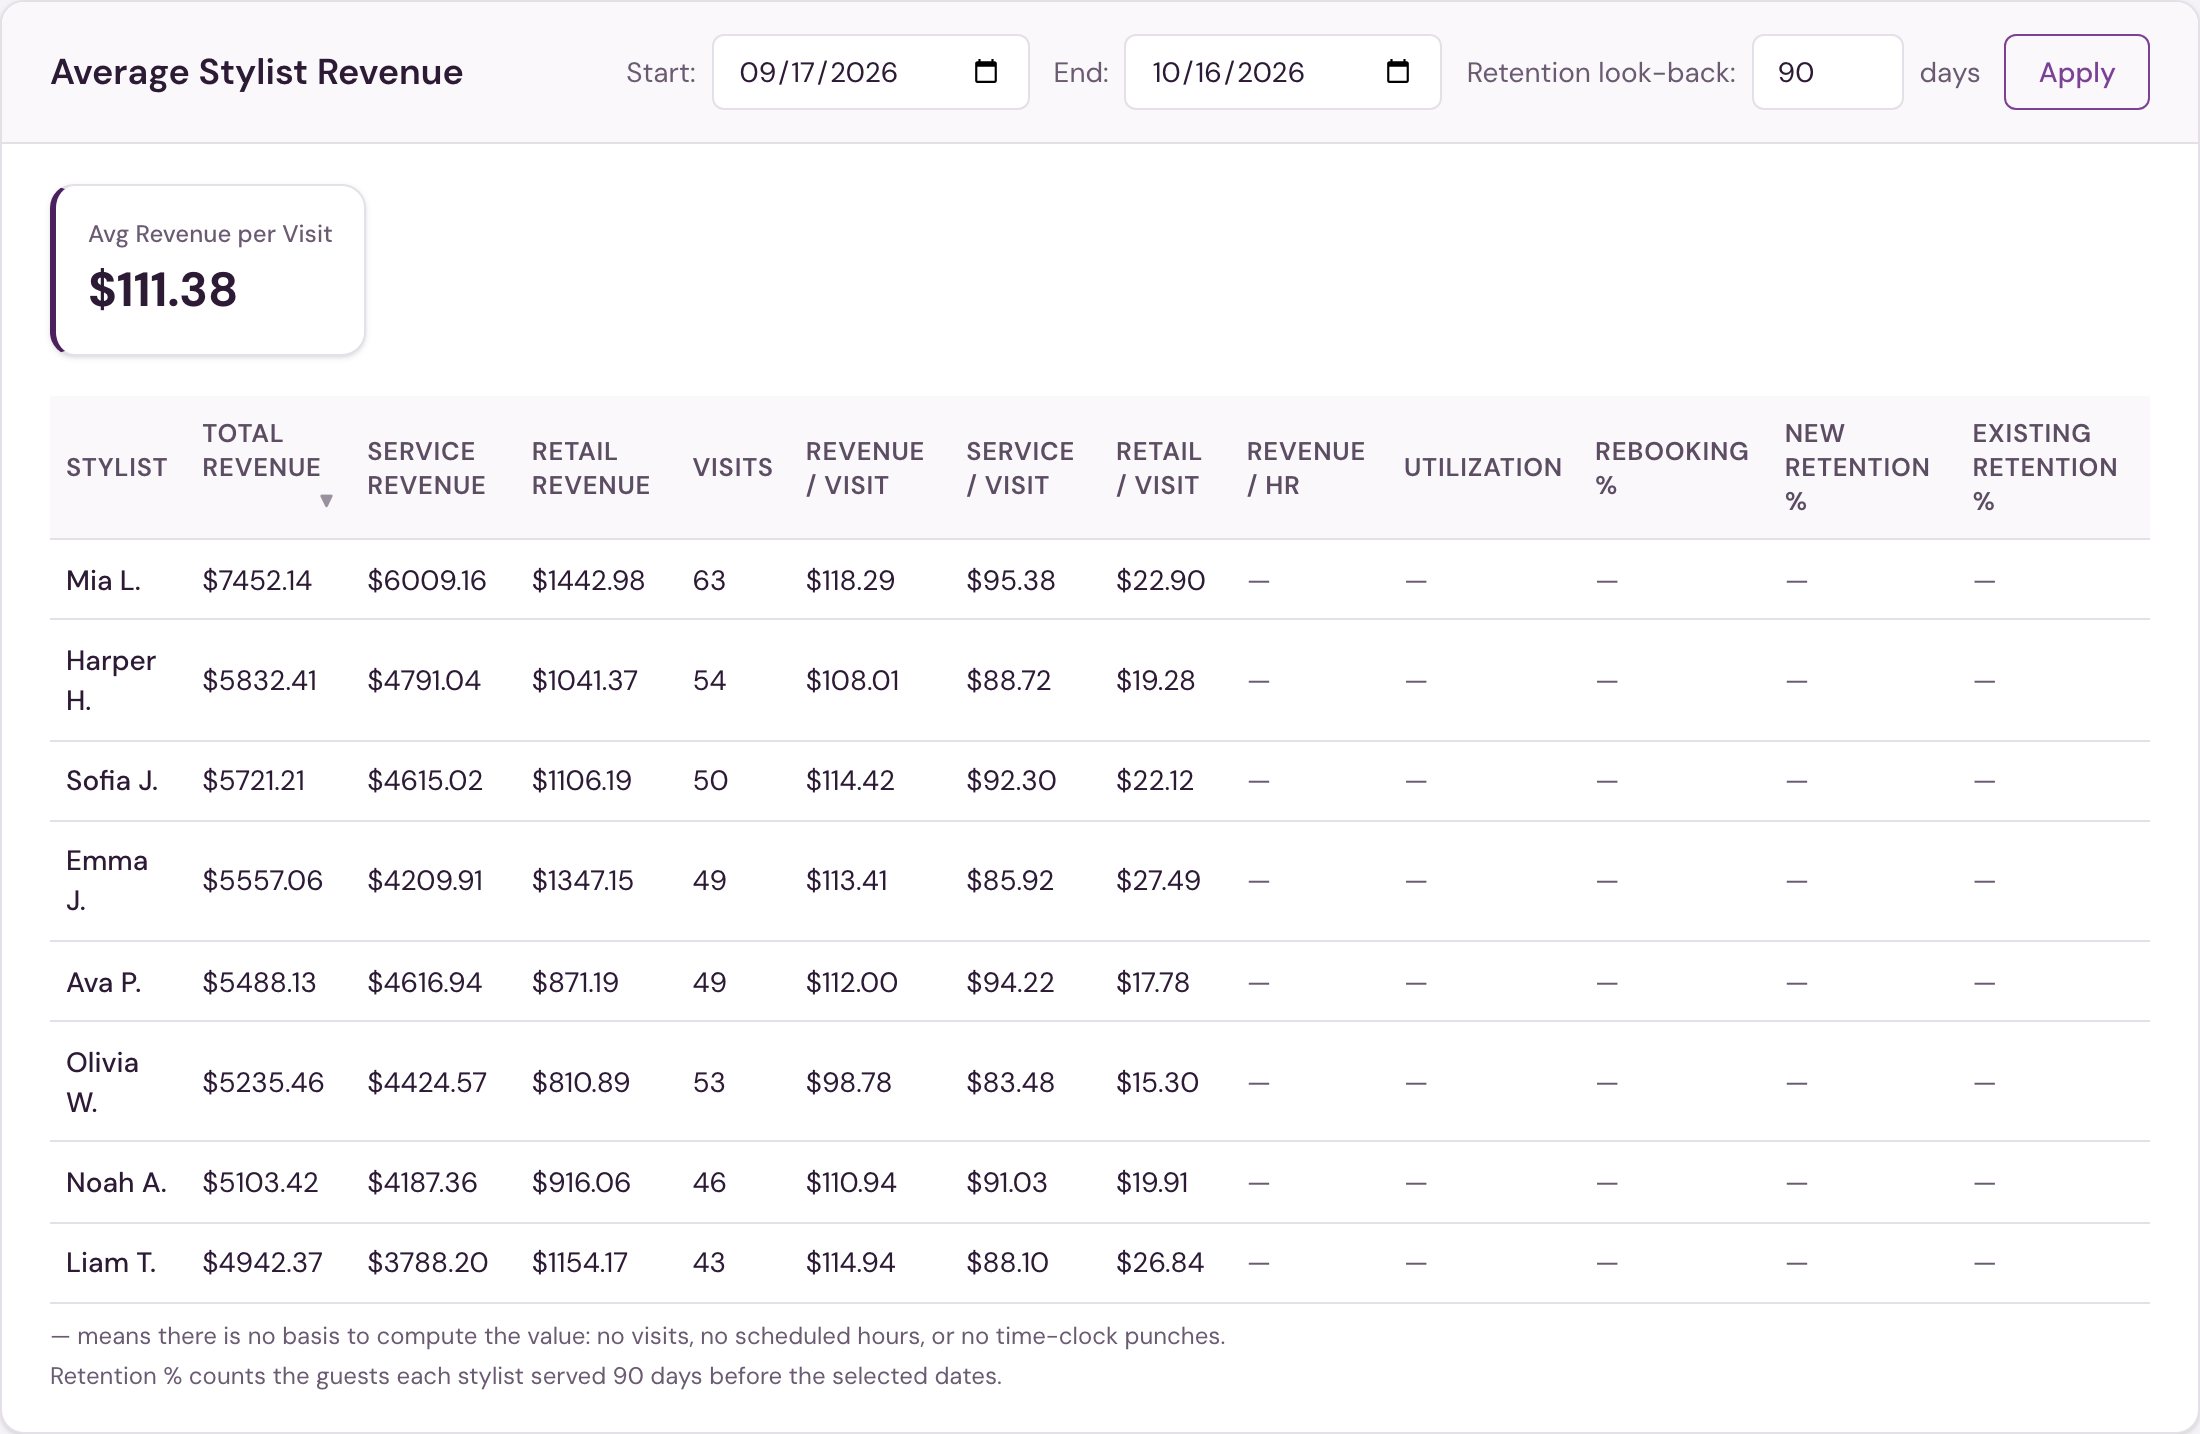
Average Stylist Revenue is the per-stylist table. Each row is one stylist; only stylists with at least one attended visit in the selected range appear. Every dollar figure here is production — the full value of the work performed, including the part paid with membership credit or prepaids (see Two ways the dashboard counts sales).
The Avg Revenue per Visit card at the top of the section is the whole table on one line:
Avg Revenue per Visit (card) = every listed stylist's Total Revenue ÷ the salon's Visits
The divisor is the salon's visits, counting a guest once per day, not the sum of the stylists' Visits, which counts a guest once per stylist. It uses this section's date range, so it can differ from the Salon Health tile of the same name when the two date ranges differ.
Retention look-back
Next to the section's dates, The Lash Lounge and Bishops have a Retention look-back box, set to 90 days. It decides which guests the two Retention % columns measure: the guests each stylist served that many days before the dates you selected (see the maturity window).
Type a different number of days (0 to 365) and click Apply to measure a more recent or an older group of guests:
- A smaller number looks at more recent guests. They have had less time to come back, so the percentages read lower. Use it to see where a stylist is heading, and compare it with the same number on another date range, not with the 90-day figure.
- A larger number looks at guests from further back, who have had longer to return.
- 0 measures the guests served in the selected dates themselves.
Only the Retention % columns change; sales, visits and every other column always cover the dates you selected. A line under the table states the look-back the rows were run with. The box stays as you set it until you leave the page, and it applies to this table only: the Retention tile in Salon Health always uses 90 days. Revenue by Employee has the same box.
The visits column reads Operational Visits, and utilization is shown as two columns, Scheduled Util. and Clocked Util. A clocked figure marked with an asterisk (105% or more) usually means a missed clock punch.
This table is called Nail It! and follows Frenchies' own employee report. Its columns are Employee Name, Service, Retail and Total Revenue, Retail % of Services, the three hourly rates described in Hourly rates at Frenchies, Average Ticket, Rebooking %, Utilization %, Request % and Star Rating/Feedback, in the same order as Zenoti's Nail It report. Request % follows Zenoti's definition: of the tickets with a service where the employee is the primary seller, the share on which the guest specifically asked for that employee. Redone services are left out, and each refund ticket takes one ticket off the count in the period the refund is dated. Star Rating/Feedback is the average guest rating on the employee's completed appointments that have a rating; it shows — when there are none. There is no Retention % column. Who appears in the table depends on the job each employee held on the last day of the dates you picked, so an employee who was a nail tech in July and moved to the front desk in September still appears in July. Sales are counted per ticket (one checkout); if two stylists worked on the same ticket, it counts for both, so the stylists' ticket counts won't add up to the studio total. A studio-wide Service Revenue Per Hour card sits above the table. The Avg Ticket card beside it covers the employees in the table, so it can differ a little from the Avg Ticket tile in Studio Health, which covers the whole studio.
| Column | What it shows |
|---|---|
| Stylist | The stylist, from your booking system's staff list. |
| Total Revenue | Service Revenue + Retail Revenue for the range. |
| Service Revenue | The full value of every service the stylist performed, credited to the day the work was done — regardless of how the guest paid (card, cash, membership credit, prepaid package). Net of sales tax. |
| Retail Revenue | Product sales credited to the staff member who earned the commission on the sale in your booking system, net of tax and tips. Retail sold and commissioned at the front desk is credited to the front-desk seller — not the stylist who performed the service — so it counts toward Salon Health but does not appear in this stylist table. Pass-through credit-card fee line items are excluded. |
| Visits | Attended visits — cancelled and no-show appointments don't count. See What counts as a visitA completed, attended appointment — booking alone doesn't count.Full definition →. |
| Revenue / Visit | Total Revenue ÷ Visits. |
| Service / Visit | Service Revenue ÷ Visits. |
| Retail / Visit | Retail Revenue ÷ Visits. |
| Revenue / Hr | Total Revenue ÷ Clocked hours. Clocked hours come from your booking system's time clock. If your salon doesn't clock in and out there (for example, a Mindbody salon that tracks time in a separate payroll system), there are no hours to divide by and the column shows — rather than $0. Scheduled hours are never used in place of clocked hours. This is the only column in the table that needs the time clock. |
| Utilization | Appointment hours ÷ Scheduled hours, as a percentage — how full the stylist's posted schedule was. Shown even at salons where the Salon Health Utilization tile is turned off. A stylist with no posted schedule in the range shows —. Full definition: UtilizationOf the hours a stylist was scheduled to work, the share filled with booked appointments.Full definition →. |
| Rebooking % | Guests who left rebooked ÷ Guests this stylist served in your selected dates. At The Lash Lounge and Bishops the next appointment must be booked with the same stylist, on or before the visit date; at Frenchies a guest counts when they're rebooked at checkout, whoever the next appointment is with, credited to the stylist who made the sale. Shows — when the stylist served no guests in the range. Full definition: Rebooking %Of the guests a stylist served, the share who left with their next appointment already booked.Full definition →. |
| New Retention % and Existing Retention % | Retention %: guests who came back to this stylist ÷ guests this stylist served, shown separately for guests seeing this stylist for the first time (New) and guests who had seen this stylist before (Existing). "Came back" means a later attended visit with the same stylist, or a future appointment with them already on the books. The guests counted are the ones served 90 days before your selected dates, so every one of them has had time to return, unless you change the Retention look-back. Shows — when the stylist served no guests in that earlier window. Full definition: Retention %Of the guests a stylist served, the share who came back to that same stylist or have a future appointment booked with them.Full definition →. |
This table is production; the Salon Health sales bars are cash collected. The table will not add up to the sales bar, and it is not supposed to — see Two ways the dashboard counts sales.
Some retail is sold and commissioned to a front-desk team member rather than a stylist. That retail counts toward Salon Health (the salon's Retail % and Avg Sales) but does not appear in the per-stylist table above, which lists only staff with attended visits. So the table's Retail column will total less than the salon's retail — the gap is front-desk retail. Front-desk sellers and their retail do appear in the Revenue by Employee report.
Hourly rates at Frenchies
Frenchies studios see three hourly-rate columns in place of Revenue / Hr, matching the hourly figures in Zenoti's Business KPI report. They use two different kinds of hours:
- Service hours — the time the employee spent actually performing services, added up from each appointment's start and end time. Two hours of pedicures is two hours, however long the employee was on the clock that day.
- Paid hours — the hours the employee was paid for, from the Zenoti time clock.
| Column | Formula |
|---|---|
| $ Service Revenue Per Hour | Service revenue ÷ Service hours |
| $ Total Revenue Per Hour | (Service revenue + Retail revenue) ÷ Service hours |
| $ Total Revenue Per Paid Hour | (Service revenue + Retail revenue) ÷ Paid hours — the Frenchies equivalent of Revenue / Hr |
An employee with no service hours in the range shows — in the first two columns; one with no paid hours shows — in the third. One kind of hours is never substituted for the other.
The $ Service Revenue Per Hour card at the top of the section is the studio-wide rate, and it is computed the way Zenoti does it: the whole studio's service revenue, including services rung up by the front desk or a manager, divided by the service providers' hours only. It will therefore read a little higher than the providers' rows suggest wherever non-providers sell services.
Sales — Year Over Year
Sales — Year Over Year shows monthly sales for the current year beside the same months in the two prior years, so seasonal patterns and growth are visible at a glance. A trend line runs over each year's bars to make month-to-month movement easier to follow. Each month shows its change versus the same month last year; the current month is marked as still in progress, and both its year-over-year change and its point on the trend line are held back until the month completes rather than comparing a partial month against a full one.
The section is cash collected (counted the same way as Salon Health's sales bars), uses its own three-year window rather than the page's date selector, and can switch between chart and table views or be downloaded as CSV. A month with no recorded sales shows no bar, which keeps a missing month visibly different from a month that genuinely took in nothing.
Average Revenue by Day of Week
Average Revenue by Day of Week is revenue: work counts on the date it was performed, at full value, whether the guest paid that day, used membership credit, or paid at another time. Taxes are excluded.
It shows the average revenue for each weekday over the trailing 26 completed weeks. Today is excluded. The section uses its own fixed window rather than another section's date selector, can switch between chart and table views, and can be downloaded as CSV.
Because this is revenue and the Salon Health bars are collections, the two are not expected to match. Day-of-week averages can also read a little below the daily figures, since they only include work performed by your service team.
Average Sales by Day of Month
Average Sales by Day of Month shows the average sales collected on each calendar date — the 1st, 2nd, 3rd, through the 31st — over the trailing 12 months. It is cash collected, like Sales — Year Over Year, so a payment counts on the date the money came in.
Today is excluded, and dates that do not exist in a month are not counted in that date's average. A real zero-sales date still counts, so quiet or closed dates remain part of the pattern. The section uses its own fixed window rather than the page's date selectors, can switch between chart and table views, and can be downloaded as CSV.
Membership Management
This section tracks the size and movement of your membership base:
Bishops doesn't sell memberships, so this section isn't shown for shops.
-
Active Members — members with a membership running today and autopay active, or who gave notice and haven't reached their termination date, and who are not on hold. A member between memberships with the next one already signed counts too. Suspended members are counted separately in the next tile, so your total membership base is Active + Suspended.
-
Suspended Members — members whose billing is paused but who haven't cancelled, as of today. A pause only counts while it's live — it has an end date, the member's autopay is still scheduled, or it began in the last 180 days. A pause that was never ended, on a membership that stopped billing long ago, is shown as Expired, not Suspended. Click the tile (View details ›) to open the suspended-members detail: every suspended guest with their phone number, contract type, and suspension window (suspended since / suspend end). The detail can be filtered by contract type and exported to CSV.
-
Month-to-date movement — how the base changed this month: new memberships, renewals, upgrades, downgrades, suspensions, terminations, and members returned from pause.
Net membership change = New memberships − Suspensions − Terminations + Returned from pause
Renewals, upgrades and downgrades are shown for information; they don't change the size of the base, so they aren't in the formula. This formula is how The Lash Lounge's figure is built; Frenchies studios use the change in active members instead (see the note below).
How each event is classified. At The Lash Lounge, a membership started this month is compared with the member's previous membership. Whether the member continued decides the event, never the name of the plan. The plan level only decides renewal, upgrade or downgrade: Classic is below Hybrid, Hybrid is below Volume, and Volume is below Mega, with PLE plans at the same level as their matching plan.
- New membership — the member had no membership that ended in the 12 months before, and the membership is still running at the end of the dates. A membership cancelled in the month it started, or before it started, is not counted (see what counts as a new member).
- Renewal — the member's previous membership ended 31 days or less before the new one started (or was still running), and the new one is at the same level.
- Upgrade — same as a renewal, but the new membership is at a higher level (Classic to PLE Classic is the same level; Classic to Hybrid is an upgrade). Changing the price of an existing membership is not a new membership and is not an upgrade.
- Downgrade — same as a renewal, but the new membership is at a lower level (Volume to Hybrid, for example).
- Termination — a True Termination: the membership ended and the member did not continue.
- Returned from pause — a member who was on hold the day before the month started, is no longer on hold, and is still a member. A pause that starts and ends in the same month counts as neither a suspension nor a return.
- A member who terminates while still on the pause they began before this month is listed under terminations but not subtracted again, because their pause already came off in the month it began. So the rows can add up to a little less than the net.
These are counts of contract events, not of members on a plan. To see who is on which membership, use the Member Report, which lists each member's membership at the start and end of the period and today.
Both member counts are live as-of-today figures — the date selector on this section drives only the month-to-date breakdown, so changing dates won't change the Active or Suspended numbers. The exact active/suspended rules for each franchise system are defined in Members & MembershipsA client with an active or suspended membership on file.Full definition →.
- Active Members counts a membership from the day it's sold, so a membership bought but not yet started already counts, matching Frenchies' Zenoti KPI report.
- Suspended Members counts memberships that are frozen (on hold at the guest's request), by the Frenchies rule. A membership suspended for a failed payment is not counted.
- An upgrade is a membership sale where the guest's previous membership was Polish Pass Select and the new one is Polish Pass Premier; a downgrade is the reverse. The previous membership must have been active at some point in the 31 days up to the sale. Founding memberships count as the same two tiers, and the same tier at a different price is neither. An upgrade or downgrade is also a new membership, so it is included in New Memberships as well.
- Membership Change is the change in active members itself: active members now, minus active members at the end of last month. Front Desk and the End-of-Day Summary show the same figure. It is not the sum of the rows beneath it, because a new membership at Frenchies is a membership sold (see the next point), which is not always a new member.
- A new membership is a membership sold on a ticket dated in the range, matching # New Memberships Sold in Zenoti's Business KPI report. A returning guest who buys again counts as a new membership, so re-signs are not shown separately.
Also on the dashboard
Below the sections above, the dashboard rounds out the day's picture with three more:
- Missing Service Notes — completed visits with no service note logged yet, so gaps get chased the same day. Notes are checked once a day, overnight, so a note entered after the check still shows as missing until the next day.
- Guest Feedback & Quality — complaints and kudos by stylist, fed by the entries your team logs in Front Desk → Feedback.
- Daily Shift Log & Notes — the day's Shift Notes, so owners see the floor's handoff notes without leaving the dashboard.
Missing Service Notes is shown at The Lash Lounge salons only. The notes your team keeps on a guest's profile show in POS Notes on the Front Desk Dashboard.
The Sales Dashboard requires Sales Dashboard access, granted per user in User Management; corporate and admin users have it automatically. For users with access it's the home page — the first thing they see after signing in. Users without it (for example, front-desk-only staff) land on the first page they're authorized to view instead, and won't see this dashboard.